Kahua Asset Analytics Package
The Kahua Asset Analytics Package is domain-wide and highly configurable. With a common focus on keeping track of assets, this set of dashboards offers key stakeholders real-time visibility into asset portfolio status and health. The functionality and layout of each dashboard will differ depending on the customer and their needs.
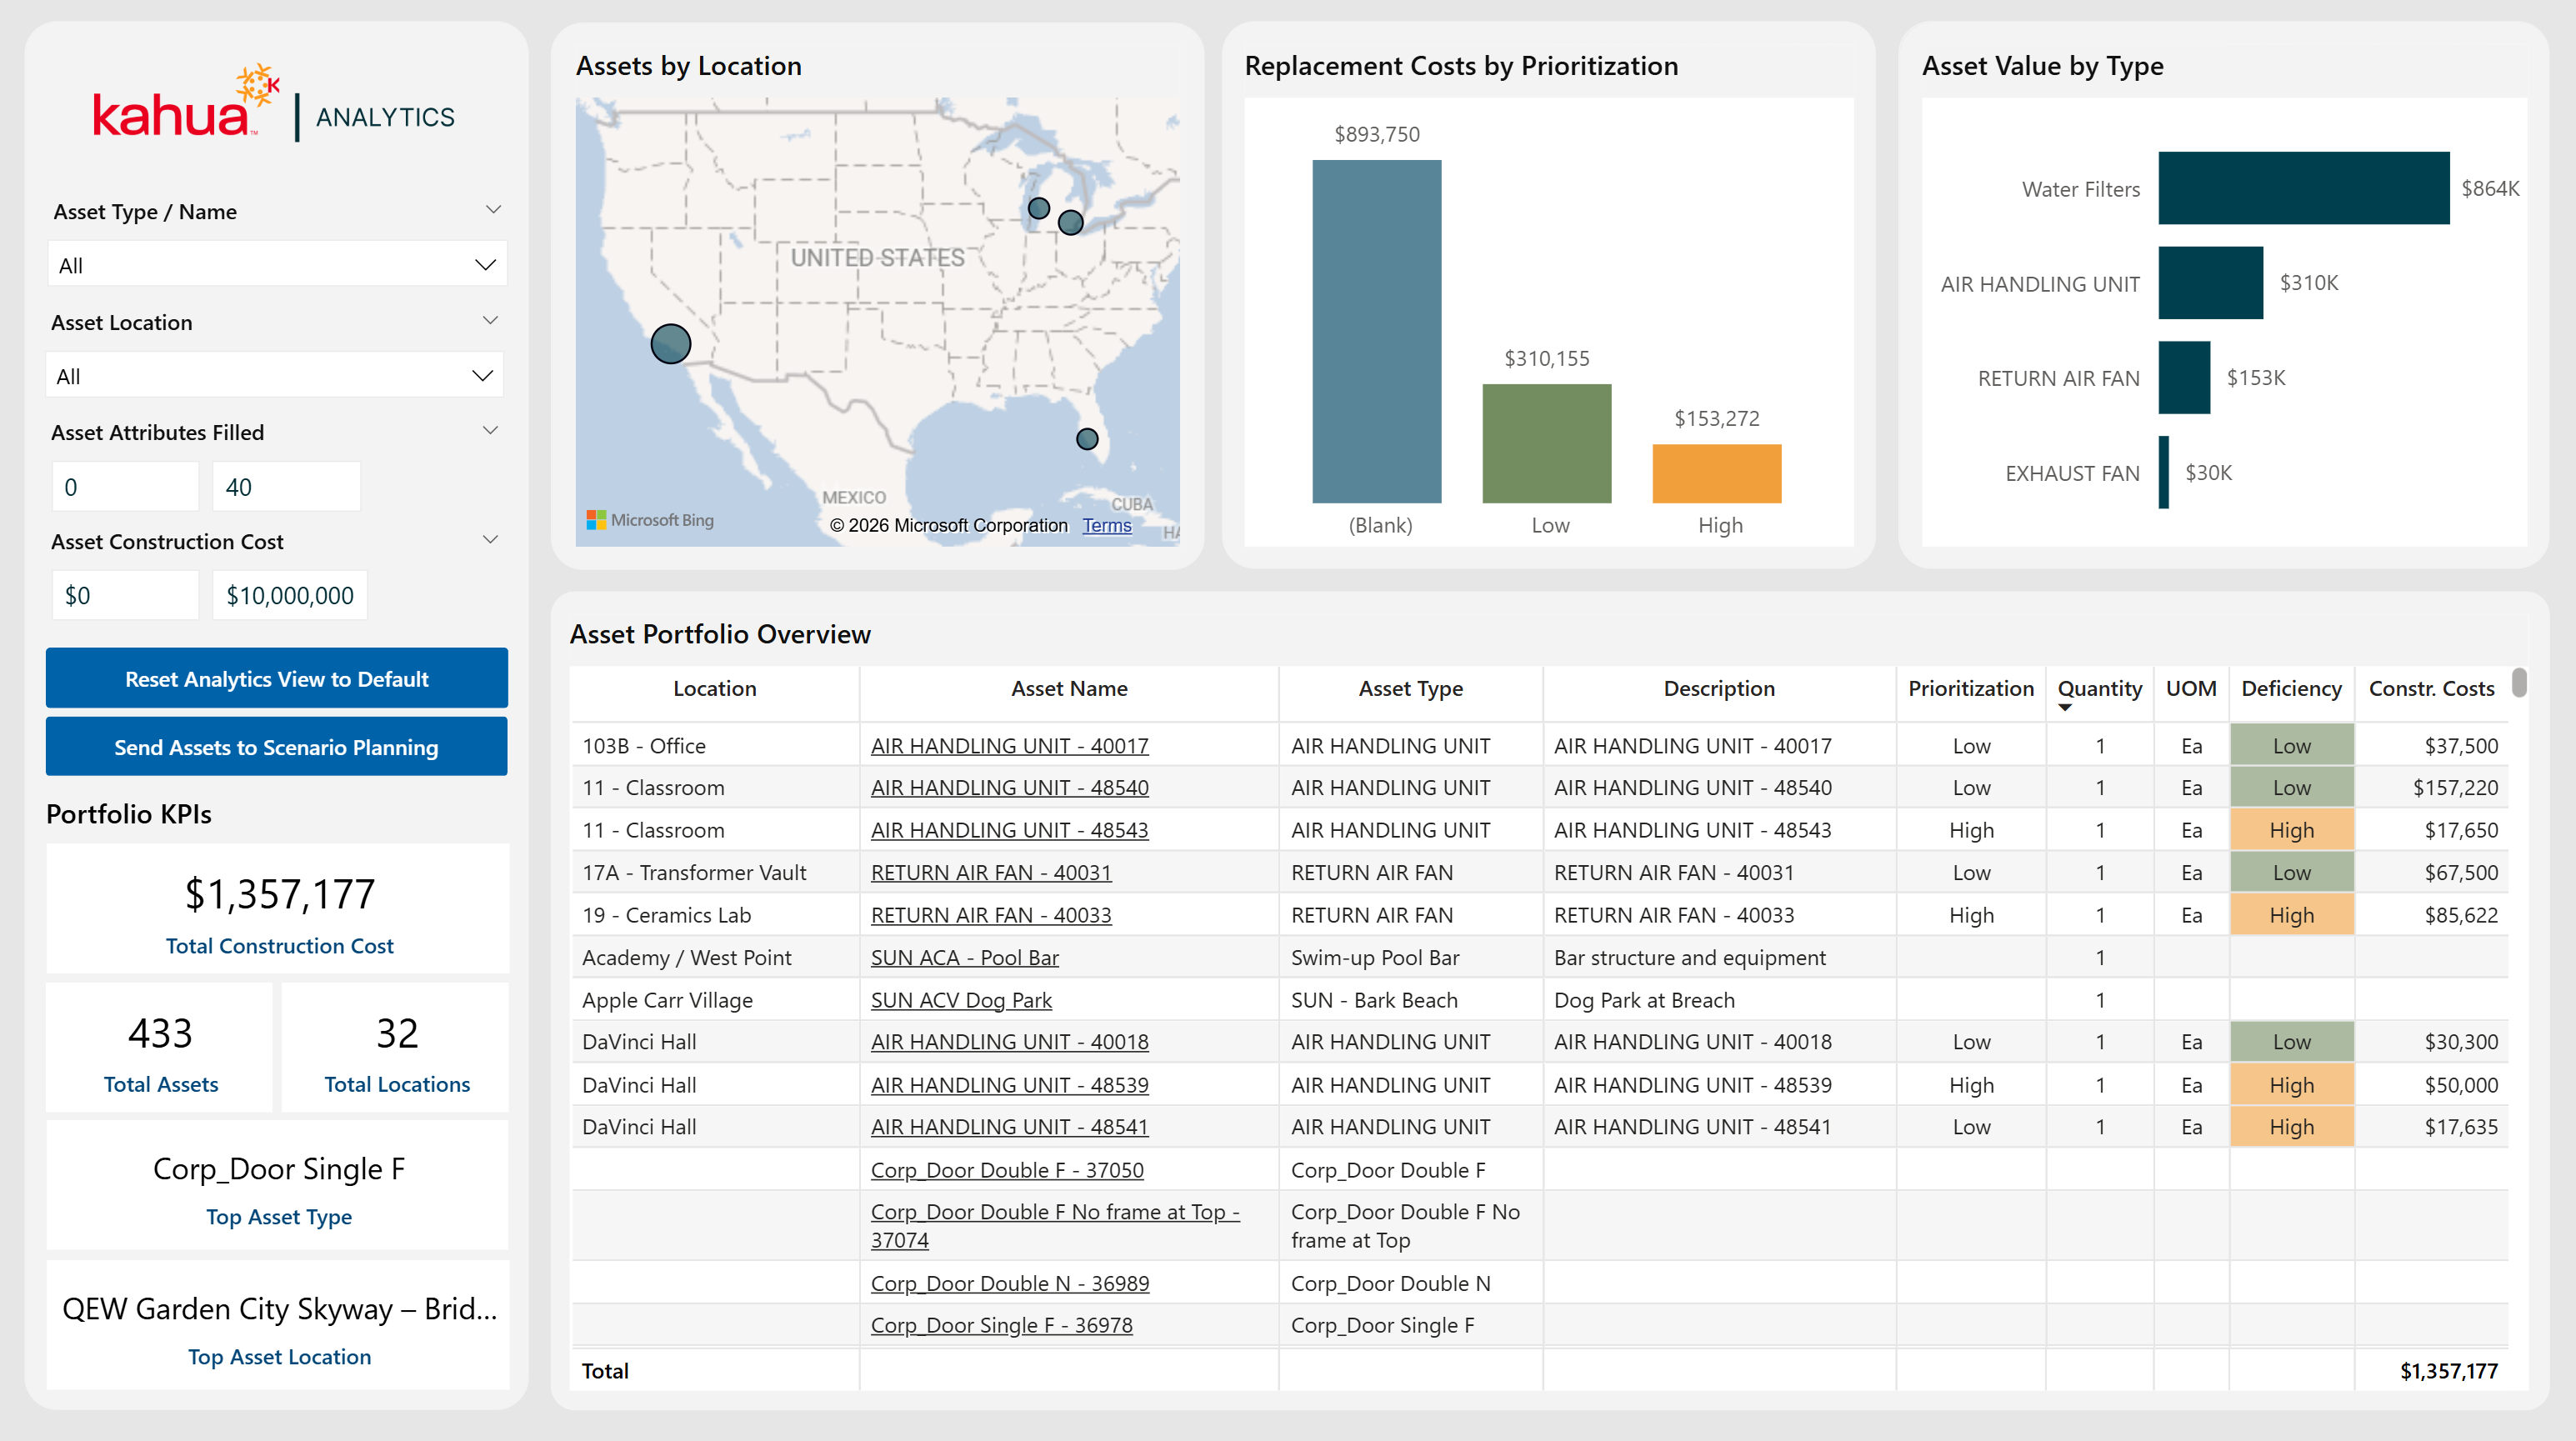
The Landing Page - Overview Dashboard helps owners manage assets across various locations and projects. Its visuals show asset distribution, assets by type, and a matrix view of key information such as location, asset name, and replacement priority.
Description
This dashboard allows users to track all assets across their domain. It provides high-level insights into asset attributes, statuses, and distribution of costs. With visuals for replacement cost and asset value, as well as a matrix view of the asset portfolio details, users can make decisions on which assets to replace. They can also quickly pin-point where faulty or broken assets are.
Problem
With vast amounts of assets spread across projects in different locations, it can be difficult to keep track of them all. However, it is important to do so to identify quantity, replacement cost, and type for speedy and accurate solutions.
Benefit
With this dashboard, users gain a high-level overview of their assets. This allows them to know where their investments are across projects and locations. They can also easily find broken or faulty assets. With the knowledge of their cost, name, type, and ID, they can act speedily. This decreases the delay of awaiting a thorough inspection to find and make all replacements.
The following apps are necessary to utilize this dashboard:
-
Asset Definition
-
Asset Manager
-
Locations
Example of the Dashboard Interface
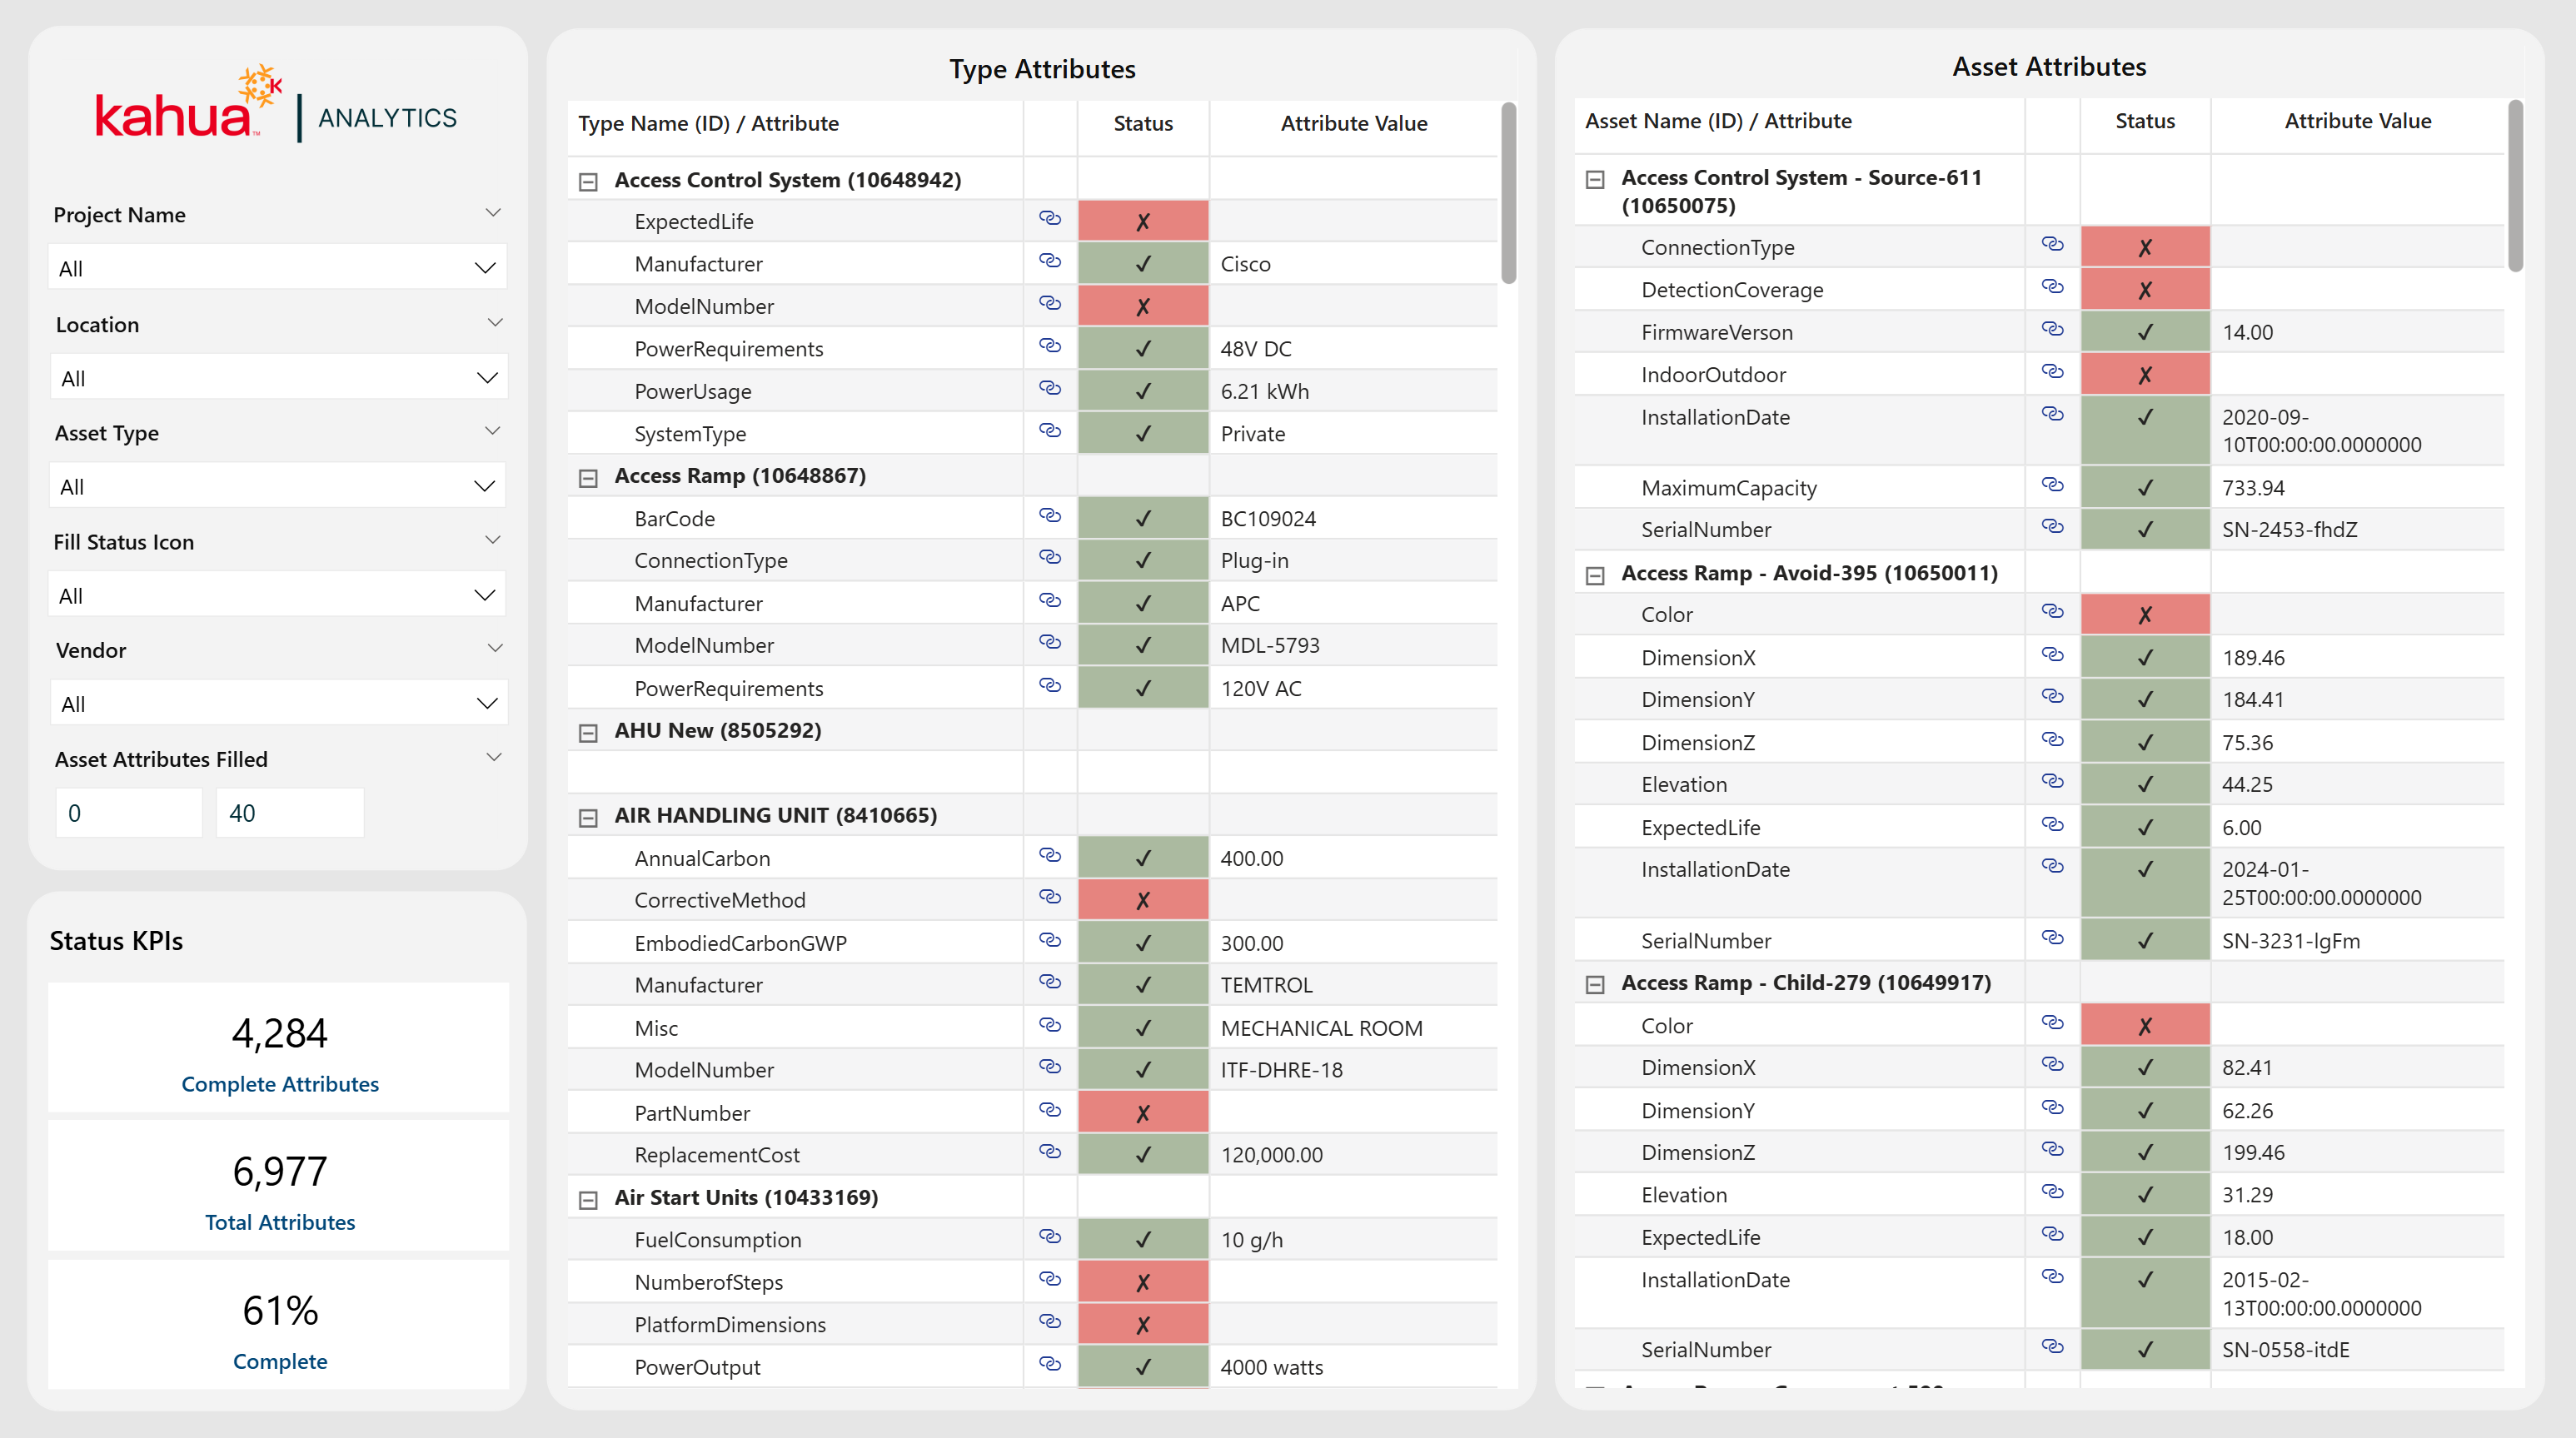
The Status of Data Collection Dashboard outlines the type and asset attributes in two distinct tables. Hence, owners can identify missing attributes and ensure they are completely filled out. Users can drill through to the Data Collection Dashboard for a higher level view, filtered automatically to display all assets across the same type/attribute.
Description
This dashboard offers users a detailed view into the attributes of asset types and individual asset instances. Split into two tables, this data encapsulates status and attribute values, such as manufacturer or serial number.
Problem
It is difficult to keep track of the countless assets spread across a domain. Knowing serial numbers, installation dates, and model numbers is imperative to monitor the health and status of these assets.
Benefit
With this dashboard, users have quick access to the most important details of their assets. This includes the vital ability to keep track of specific attributes that are missing and need to be filled out. This allows users to have a point of reference when an asset fails. Also, if one does fail, they can utilize this information to decide how best to replace it.
The following apps are necessary to utilize this dashboard:
-
Asset Definition
-
Asset Manager
-
Locations
-
Project
Example of the Dashboard Interface
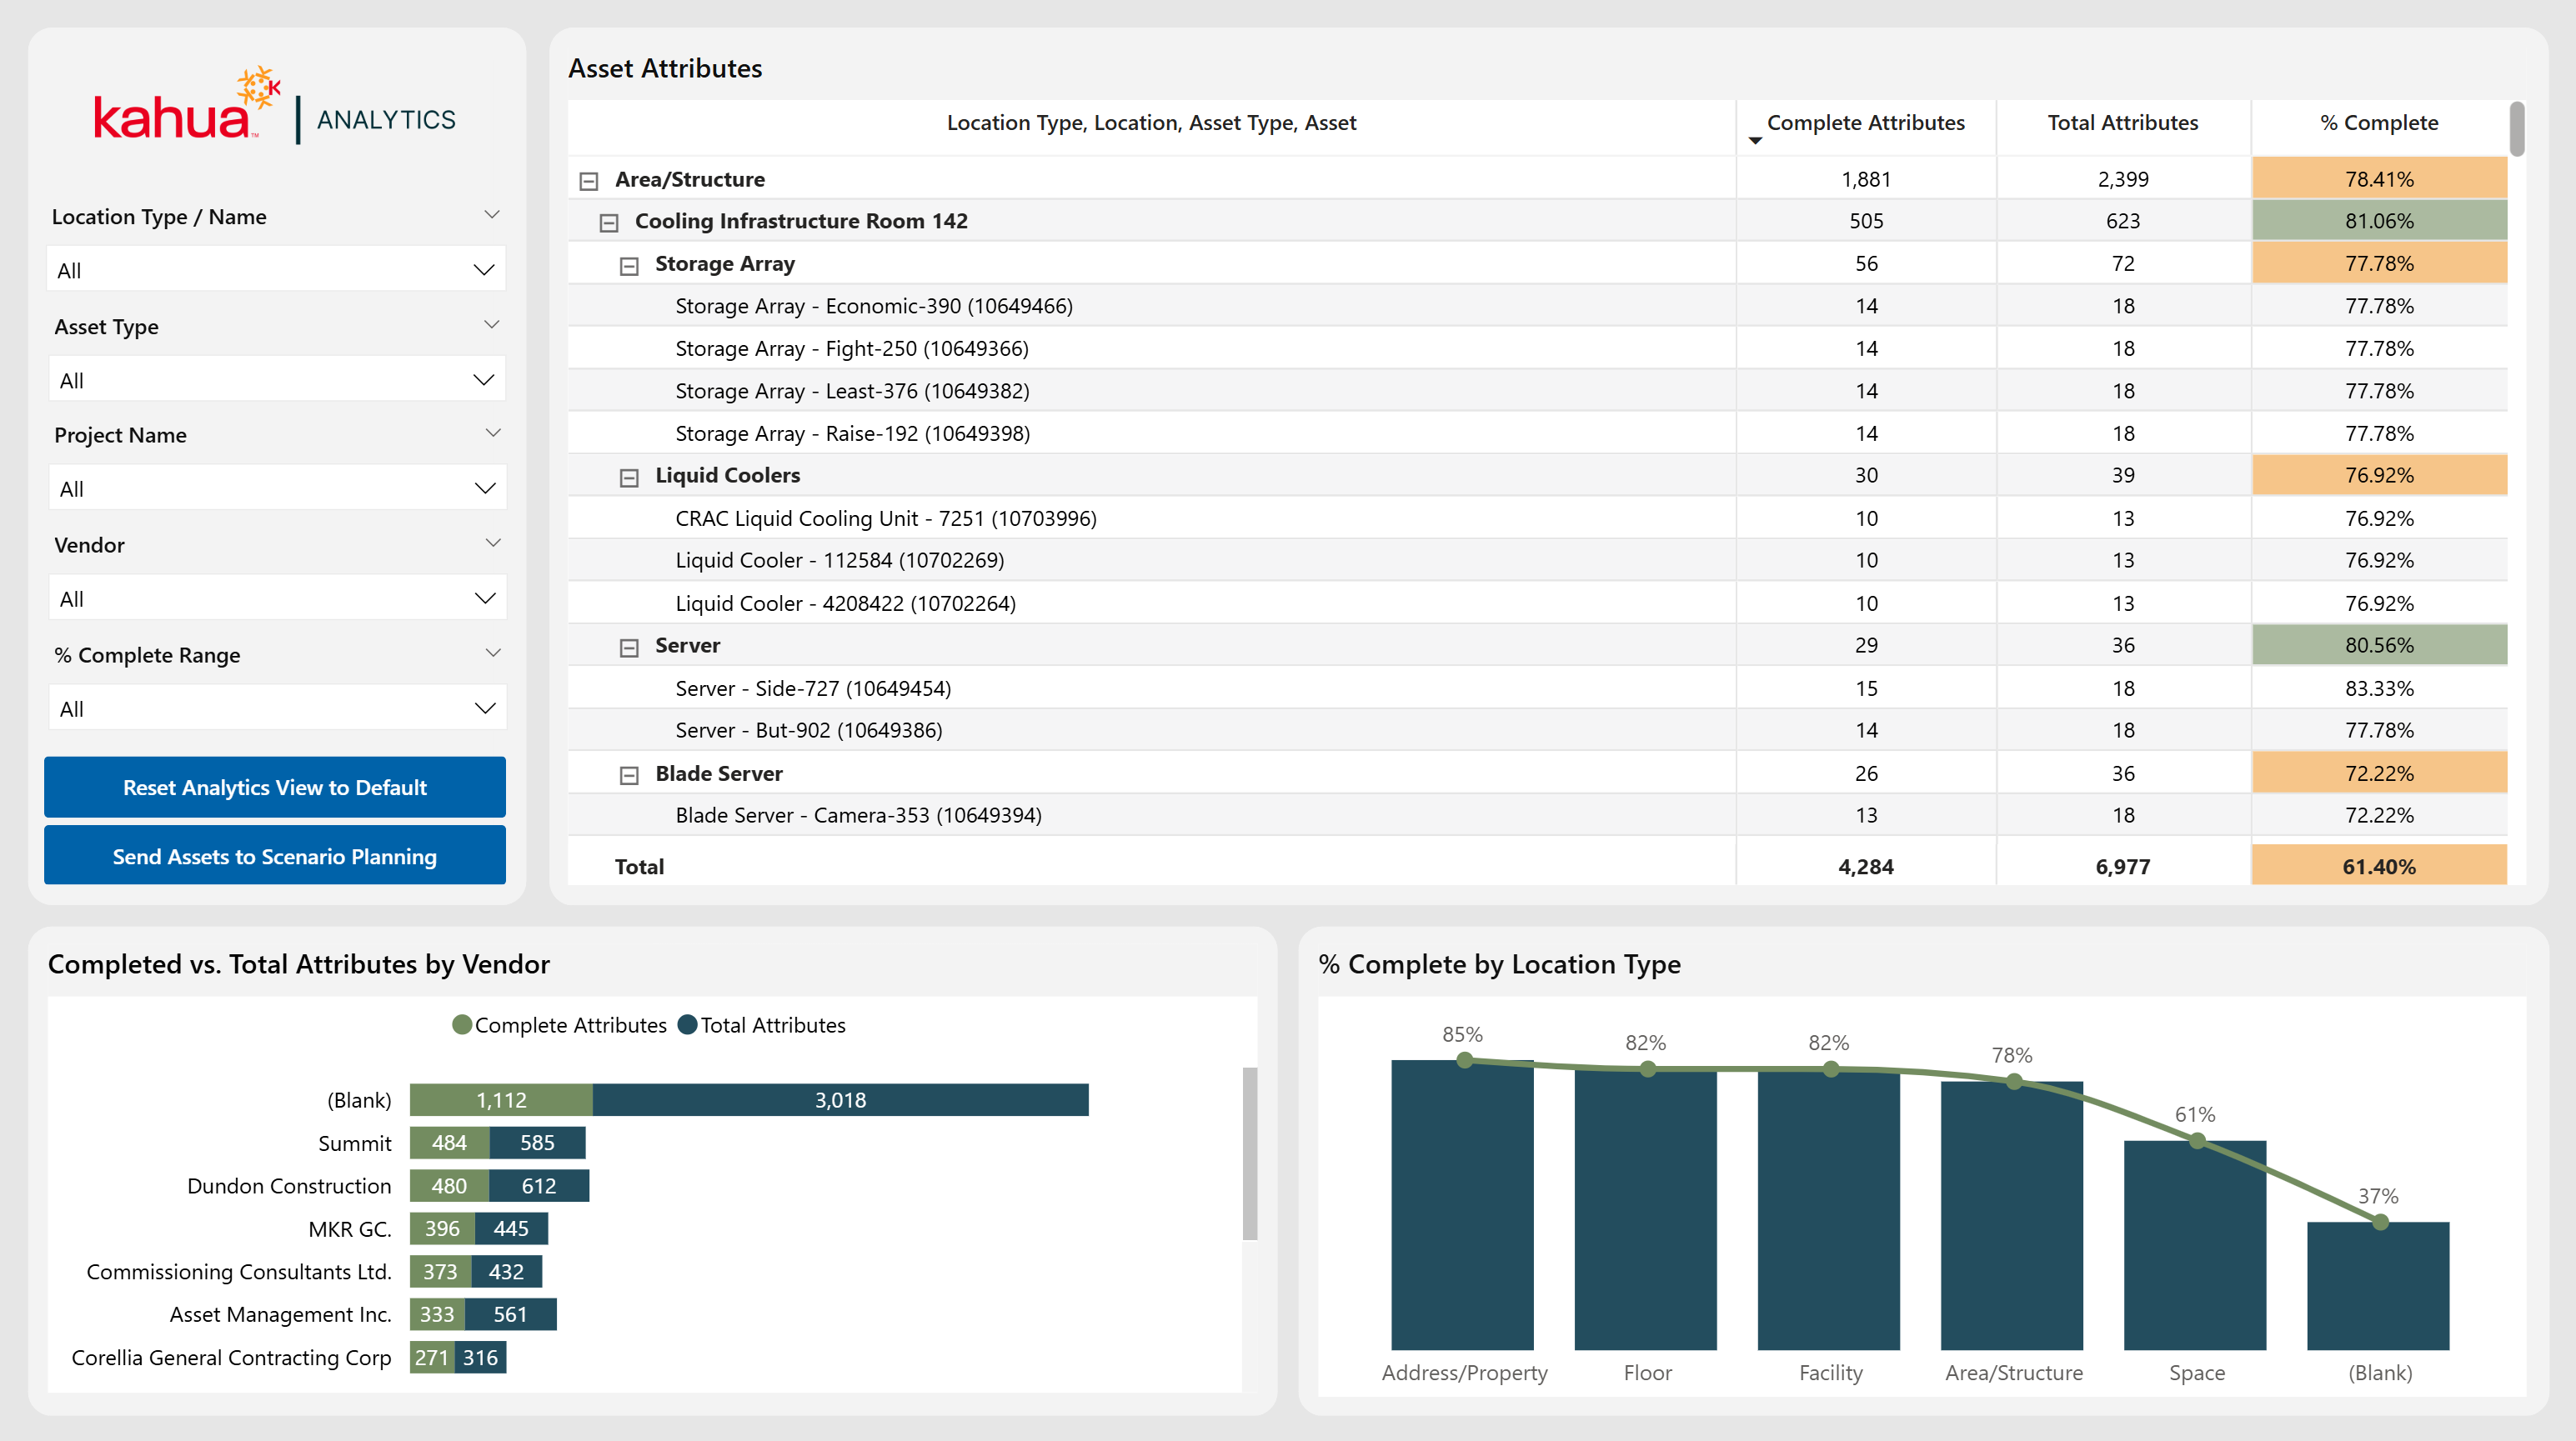
The Data Collection Dashboard helps owners monitor the progress of data collection for various assets early in the asset life cycle. This dashboard sums up the entire asset portfolio and displays it as a checklist to identify missing data points and assess their data quality.
Description
This dashboard functions as a comprehensive checklist. With visuals for Completed vs Total Attributes by Vendor and completion by location type, it allows owners to easily see which assets have been commissioned or completed. Thus, they can keep subcontractors accountable for the quality and completeness of their work.
Problem
Missing information and attributes can lead to confusion on the completion of asset installation. A costly inspection of the facility is necessitated to ensure the assets are safe and functional.
Benefit
With this dashboard, the risk of asset malfunction and the costs associated with extra inspections are mitigated. Users can quickly see which assets have been properly commissioned via the percentage of their completed attributes. Thus, they can address issues with incomplete information early on.
The following apps are necessary to utilize this dashboard:
-
Asset Definition
-
Asset Manager
-
Locations
-
Project
Example of the Dashboard Interface
The Document Tracking dashboard provides actionable insight into asset portfolio health through centralized documentation visibility and data completeness tracking. It enables project teams to quickly assess document coverage, quality, and closeout readiness across their portfolio.
Description
This dashboard links assets to their associated, tagged documents across the asset lifecycle. It visualizes asset-level document counts, key closeout indicators such as O&M and Warranty documentation, as well as drill-down capabilities to review detailed document records tied to each asset.
Problem
Project teams often lack a consolidated view of asset documentation, making it difficult to identify documentation gaps, assess compliance progress, and determine overall asset handover and closeout readiness.
Benefit
The Document Tracking dashboard provides a comprehensive, portfolio-level view of asset documentation status, compliance, and handover preparedness. This enhanced visibility supports more informed decision-making and stronger asset management.
The following apps are necessary to utilize this dashboard:
-
Asset Definition
-
Asset Manager
-
Locations
Example of the Dashboard Interface
![]()
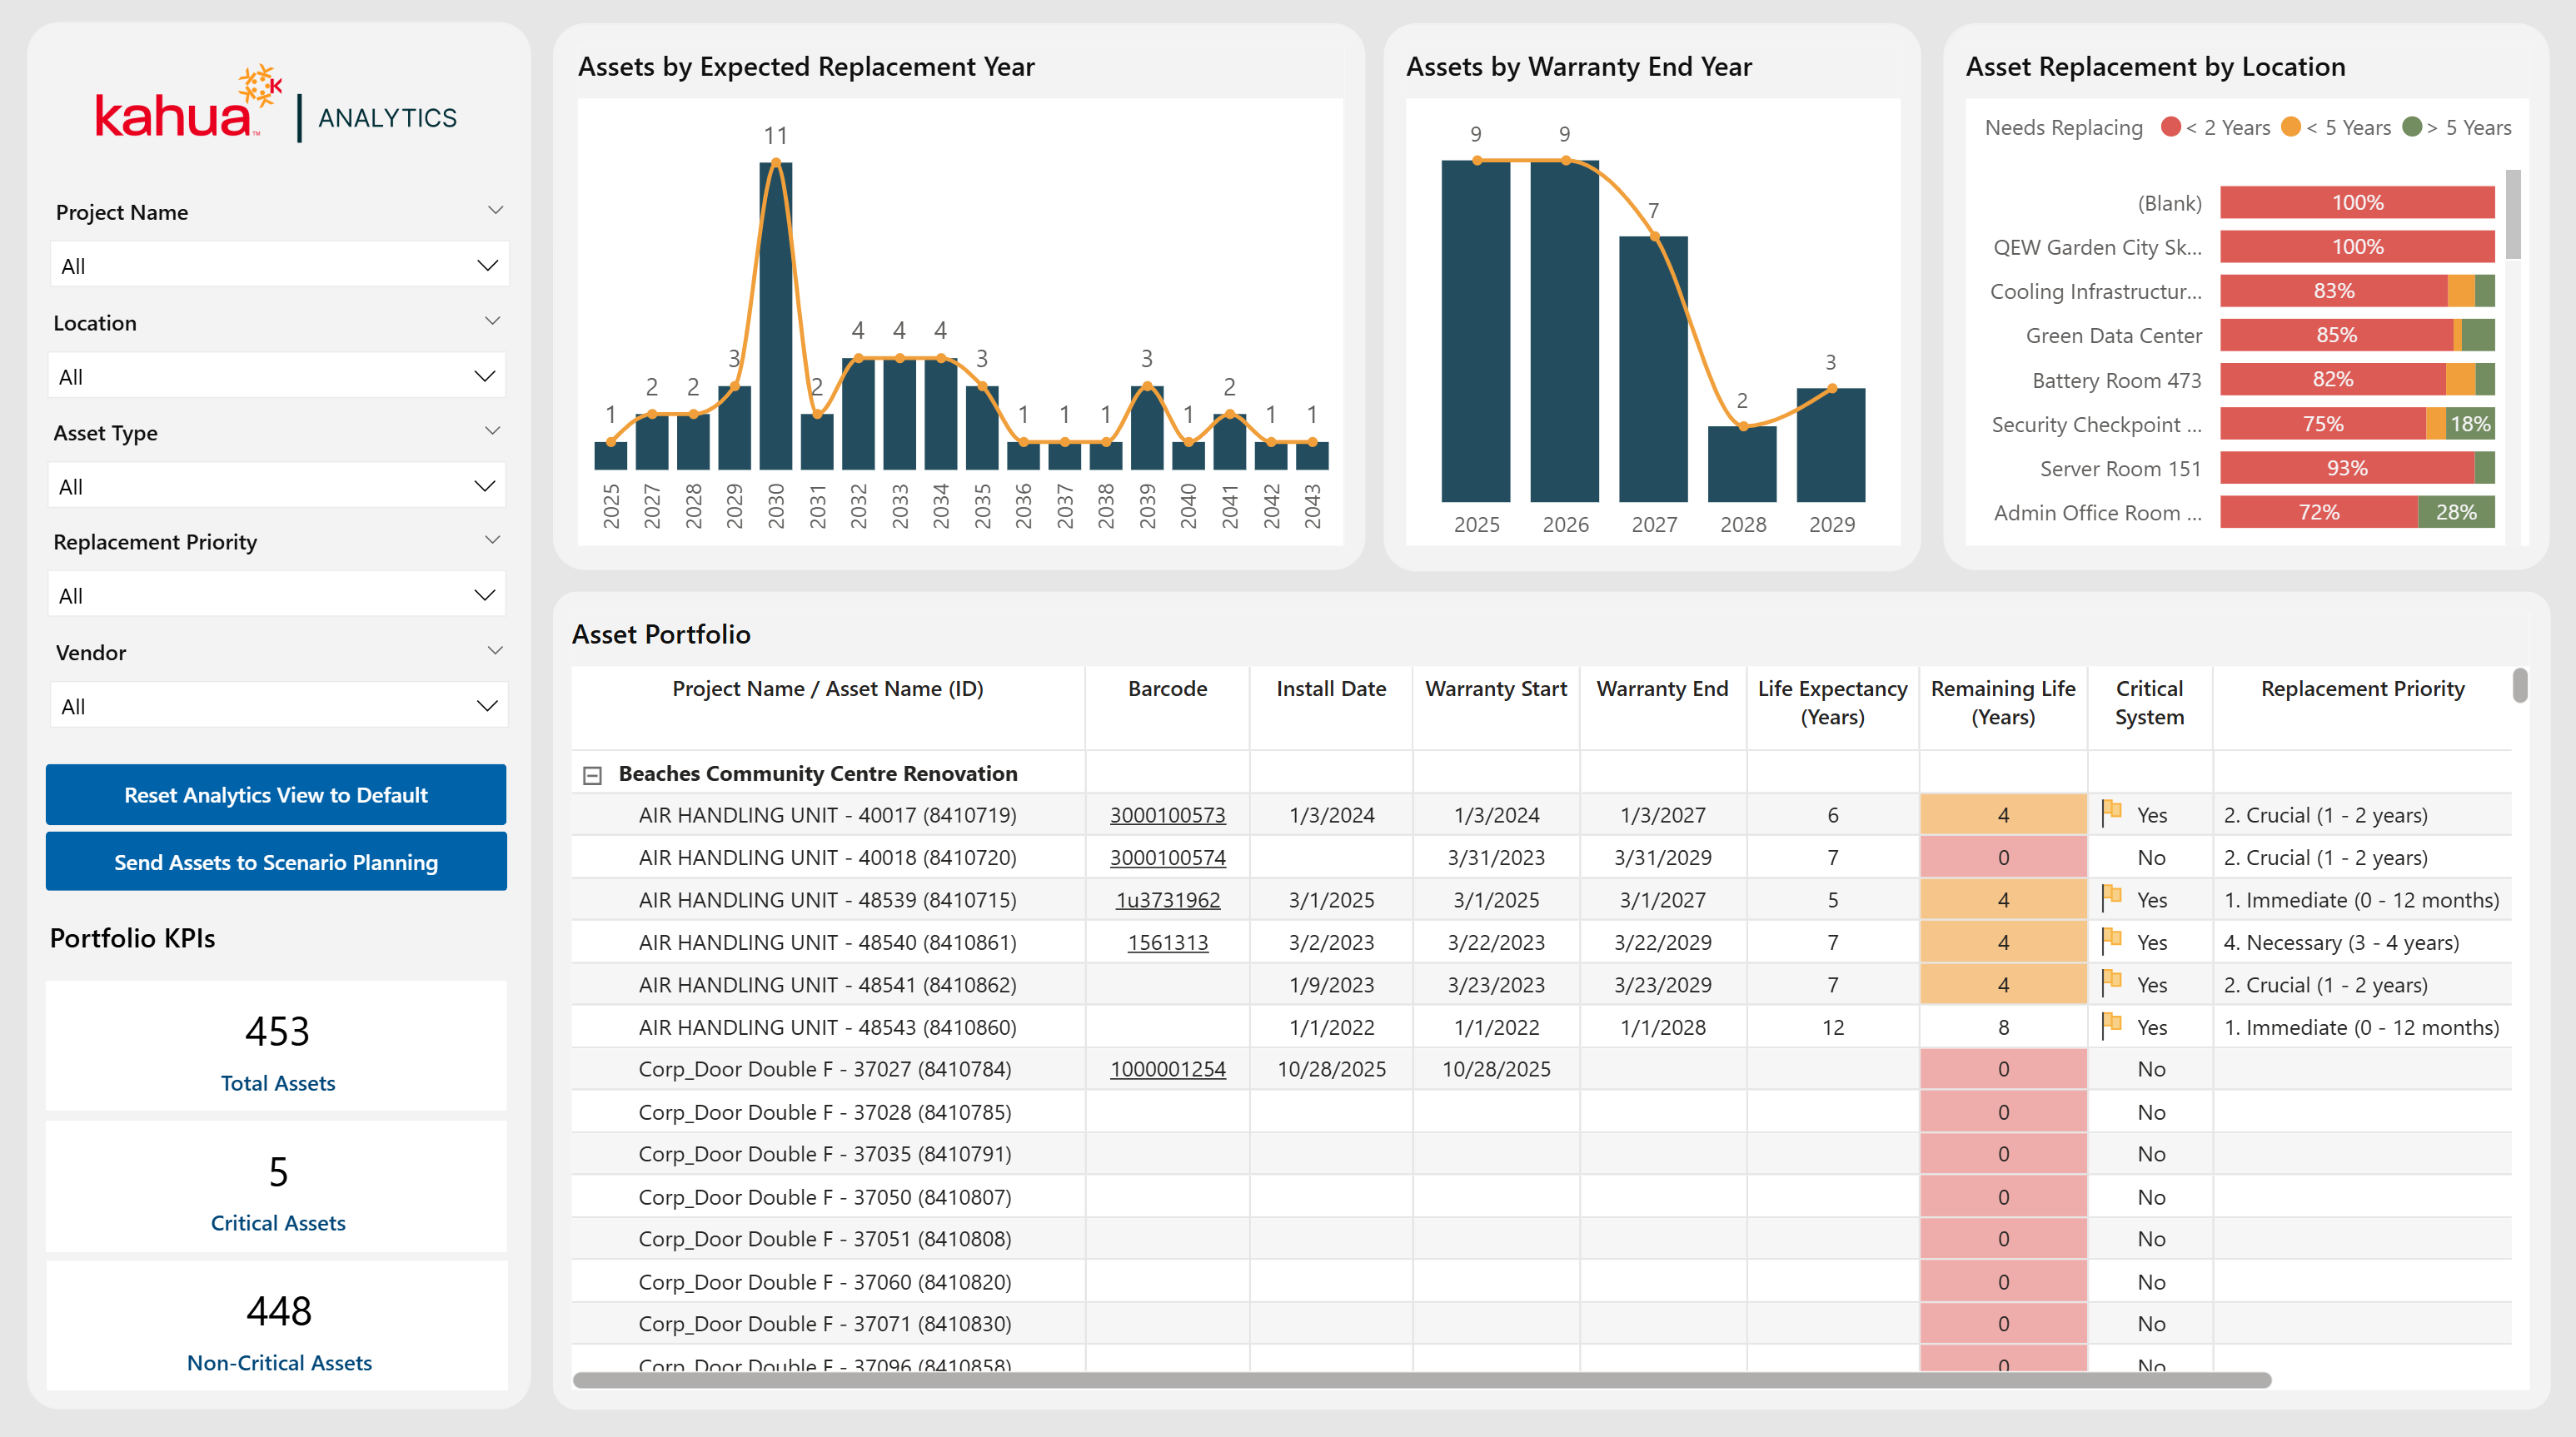
The Replacement Planning Dashboard utilizes metrics to dynamically generate reports that identify the assets that require immediate replacement. It also offers a look into future replacements for planning and budgeting purposes. With visuals displaying the health, cost, barcode, and date attributes of the assets, they can gain an overview of their domain's asset portfolio.
Description
This dashboard aims to help users track and prioritize asset replacements. Using metrics such as replacement plan and cost, it showcases the assets in instant need of replacement. Additionally, it tracks commissions, decommissions, repairs, and replacements.
Problem
It is difficult to monitor details such as the warranties, locations, and replacement priorities of many diverse assets.
Benefit
With this dashboard, users can review their portfolio assets. With data on expected replacement year, warranty end year, and locations, they can plan and budget for asset replacements.
The following apps are necessary to utilize this dashboard:
-
Asset Definition
-
Asset Manager
-
Locations
-
Project
Example of the Dashboard Interface
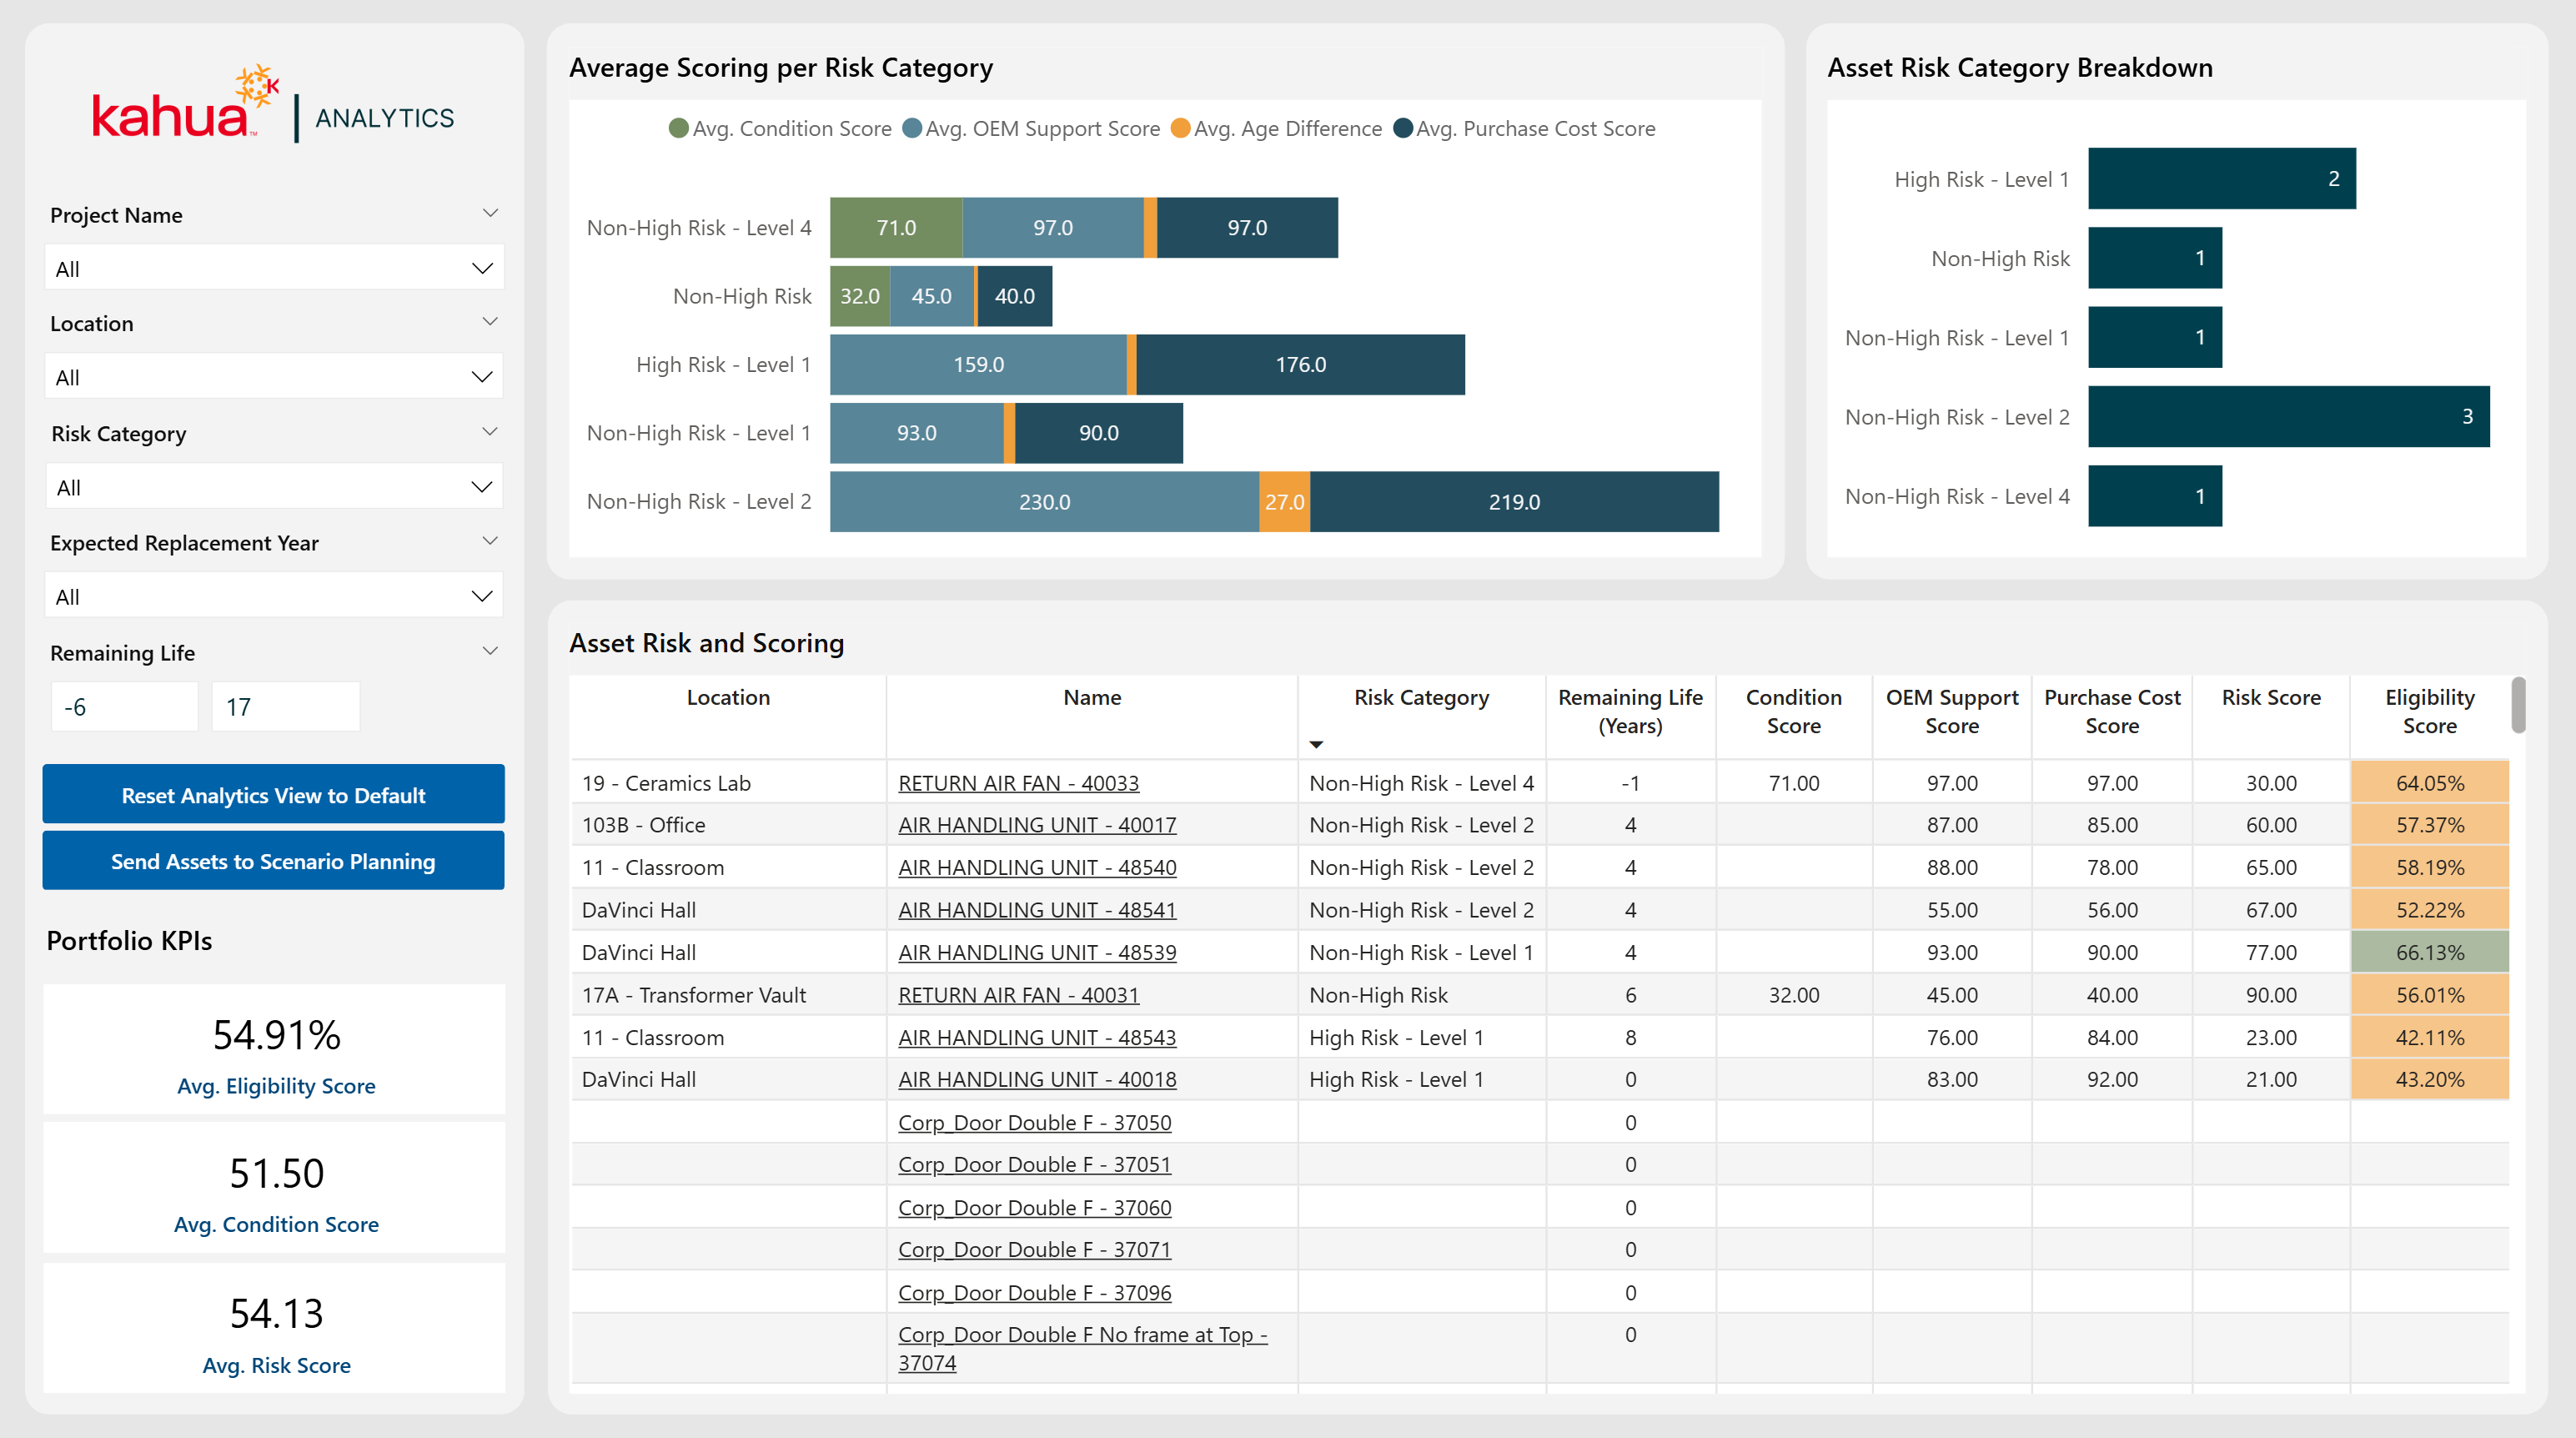
The Risks and Scoring Dashboard showcases key details regarding the health and lifetime of an asset. This includes the OEM, purchase, risk, and eligibility scores. With visuals highlighting high risk categories, as well as scores by category, users can understand what assets will need to be replaced and when.
Description
This dashboard adapts Kahua's asset-scoring methodology to show the likelihood of an asset needing replacement based on its quality. Through displaying the composite scores of assets in a portfolio, it gives users a comprehensive view of the likelihood and eligibility of an asset for replacement.
Problem
Tracking the scores of assets is important to gaining insight into asset performance, as well as the proximity and likelihood of an impending replacement. Without proper score tracking, users may be unaware of which vendors sell faulty assets consistently, as well as poor subcontractor and general contractor performance.
Benefit
With this dashboard, users can see the scores of their assets, as well as those at highest risk of requiring replacement.
The following apps are necessary to utilize this dashboard:
-
Asset Definition
-
Asset Manager
-
Locations
-
Project
Example of the Dashboard Interface
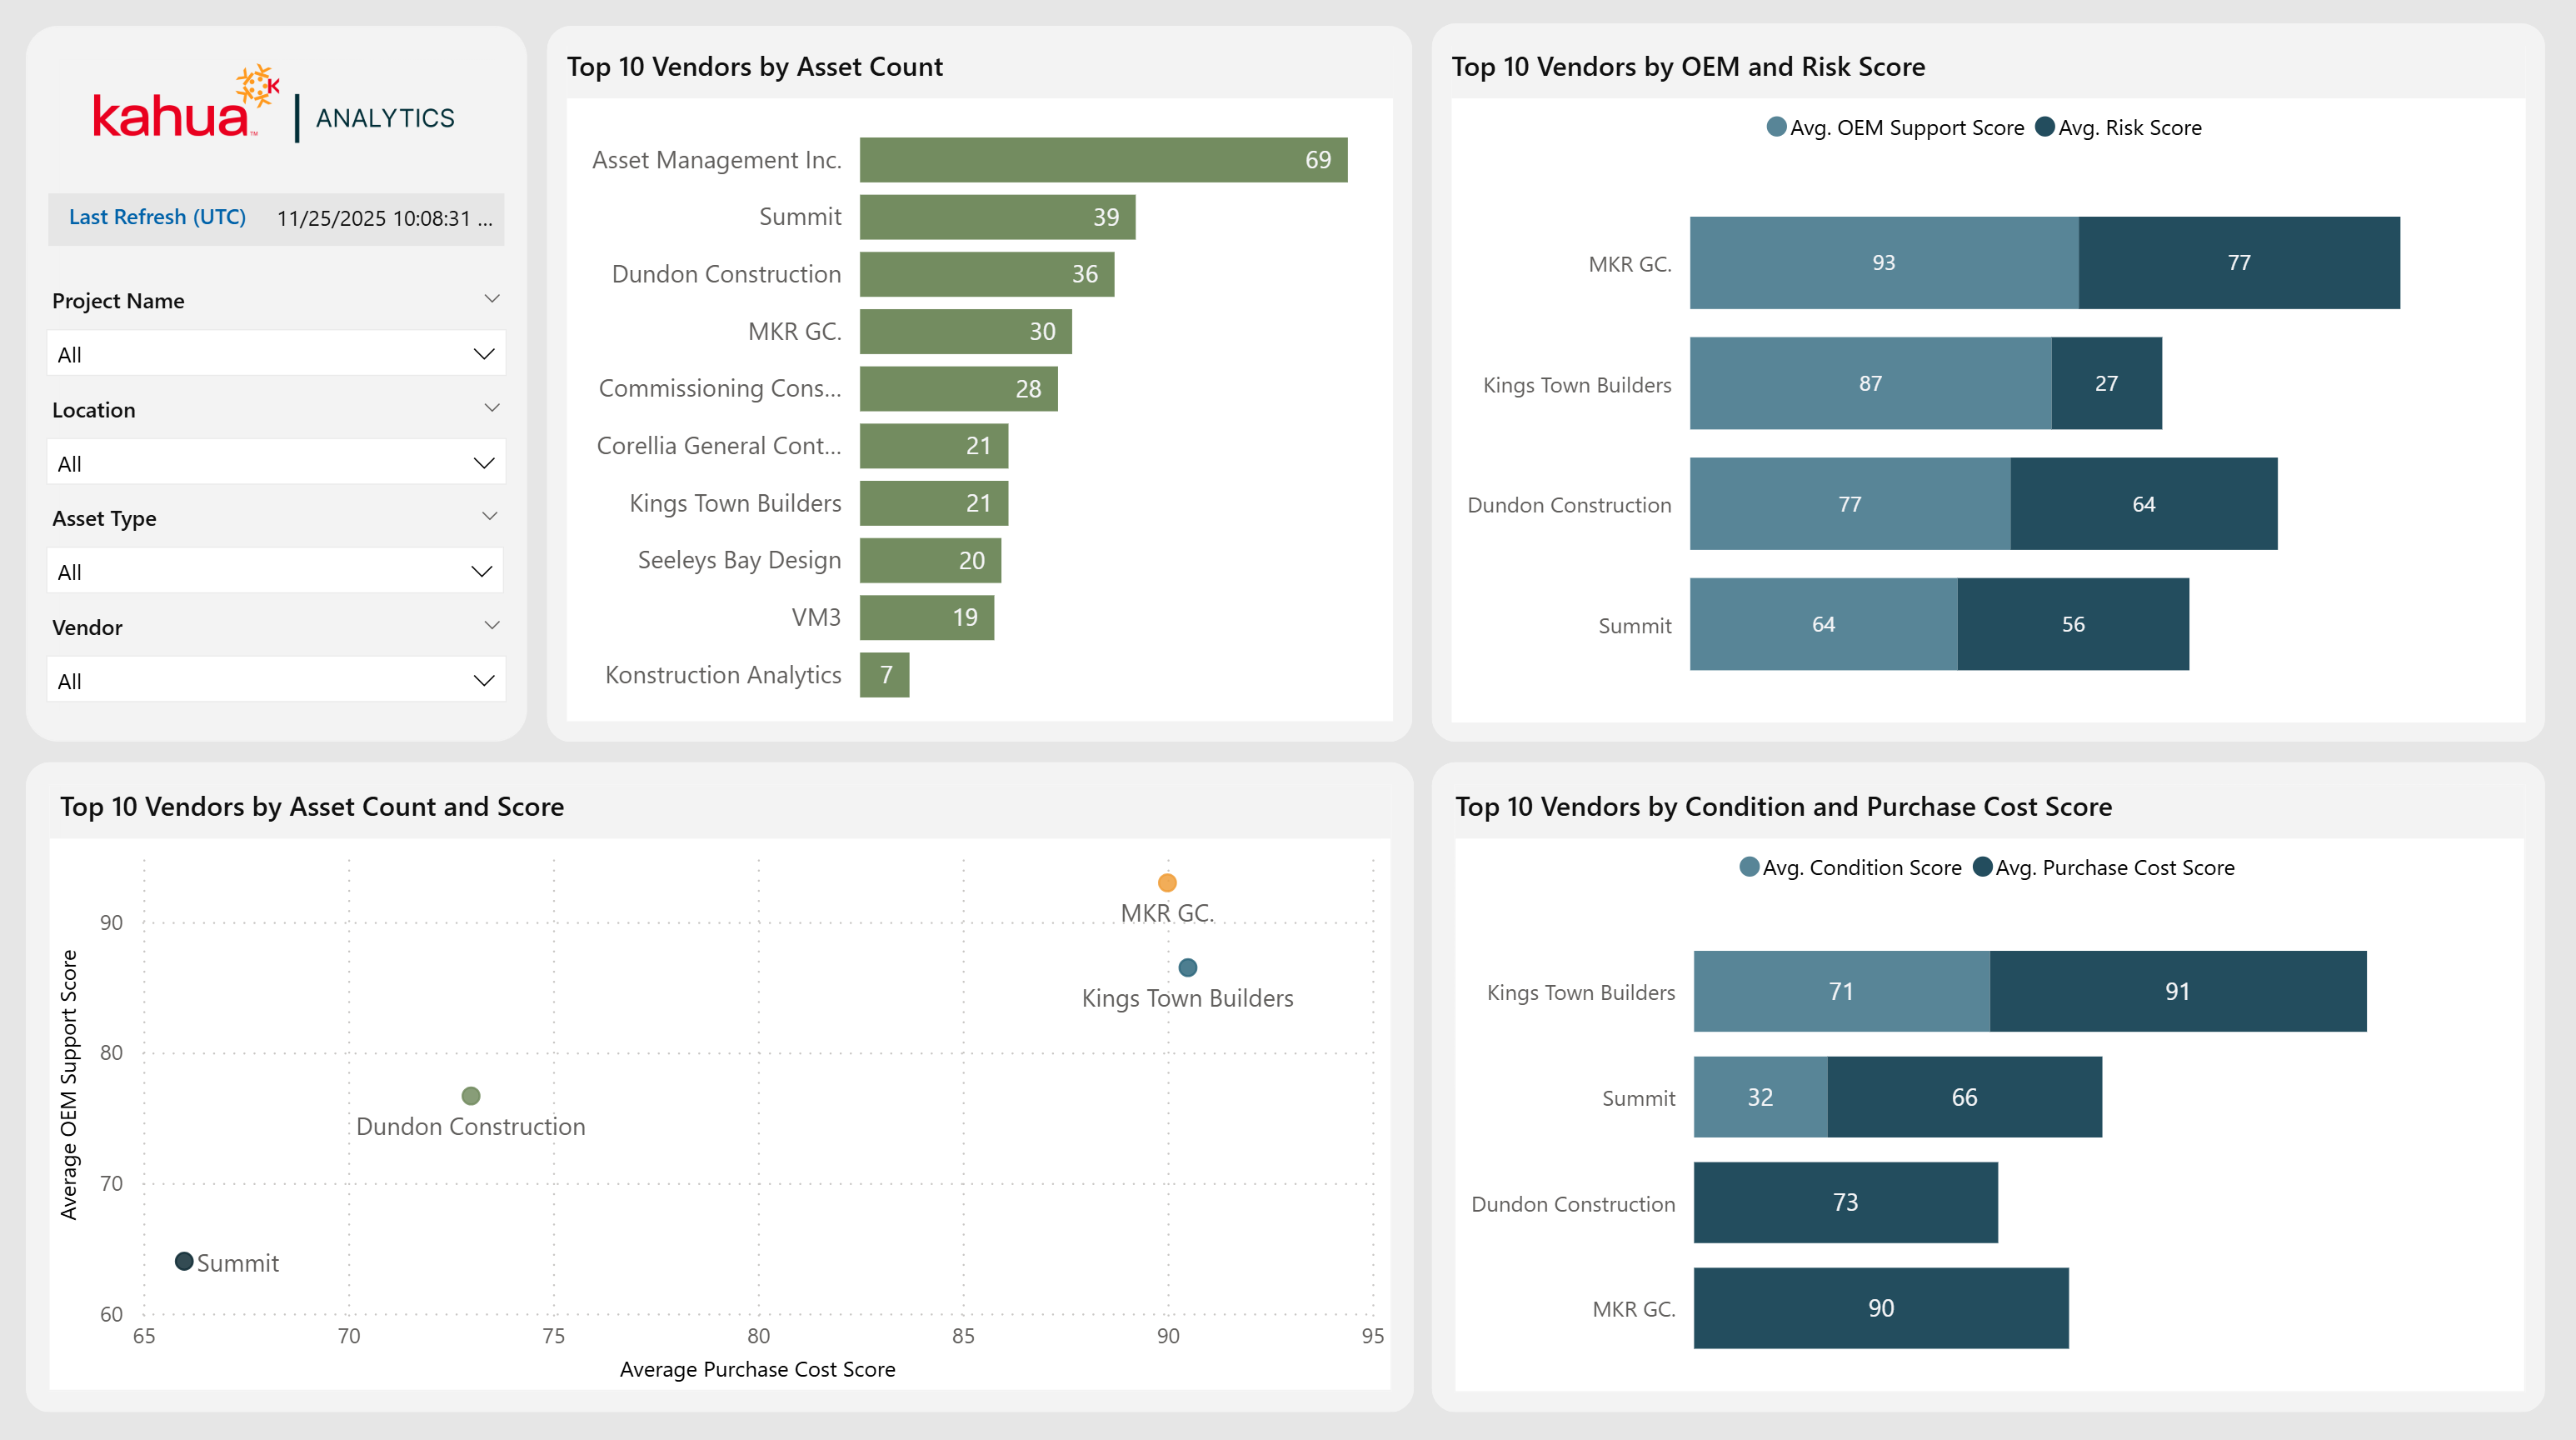
The Vendor Comparison Dashboard provides a comprehensive analysis of vendor performance and asset distribution. By leveraging asset attributes, vendor details, and risk and cost scores, this dashboard enables users to evaluate vendor impact, compare performance, and identify cost-efficient partnerships.
Description
This dashboard highlights the most cost-efficient and low risk asset vendors. Thus, users can pin-point advantageous partnerships with quality vendors.
Problem
Partnerships with vendors who provide consistently well-made assets are preferable. However, without the means to keep track of the vendors who distributed the assets in use, it is difficult to decide which relationships are worth keeping.
Benefit
With this dashboard, owners can see trends in vendor performance. This data allows them to evaluate vendors across various measures, tailored to their priorities. Furthermore, providers with low-risk scores are highlighted. Users can then decide which partnerships to continue.
The following apps are necessary to utilize this dashboard:
-
Asset Definition
-
Asset Manager
-
Locations
-
Project
Example of the Dashboard Interface
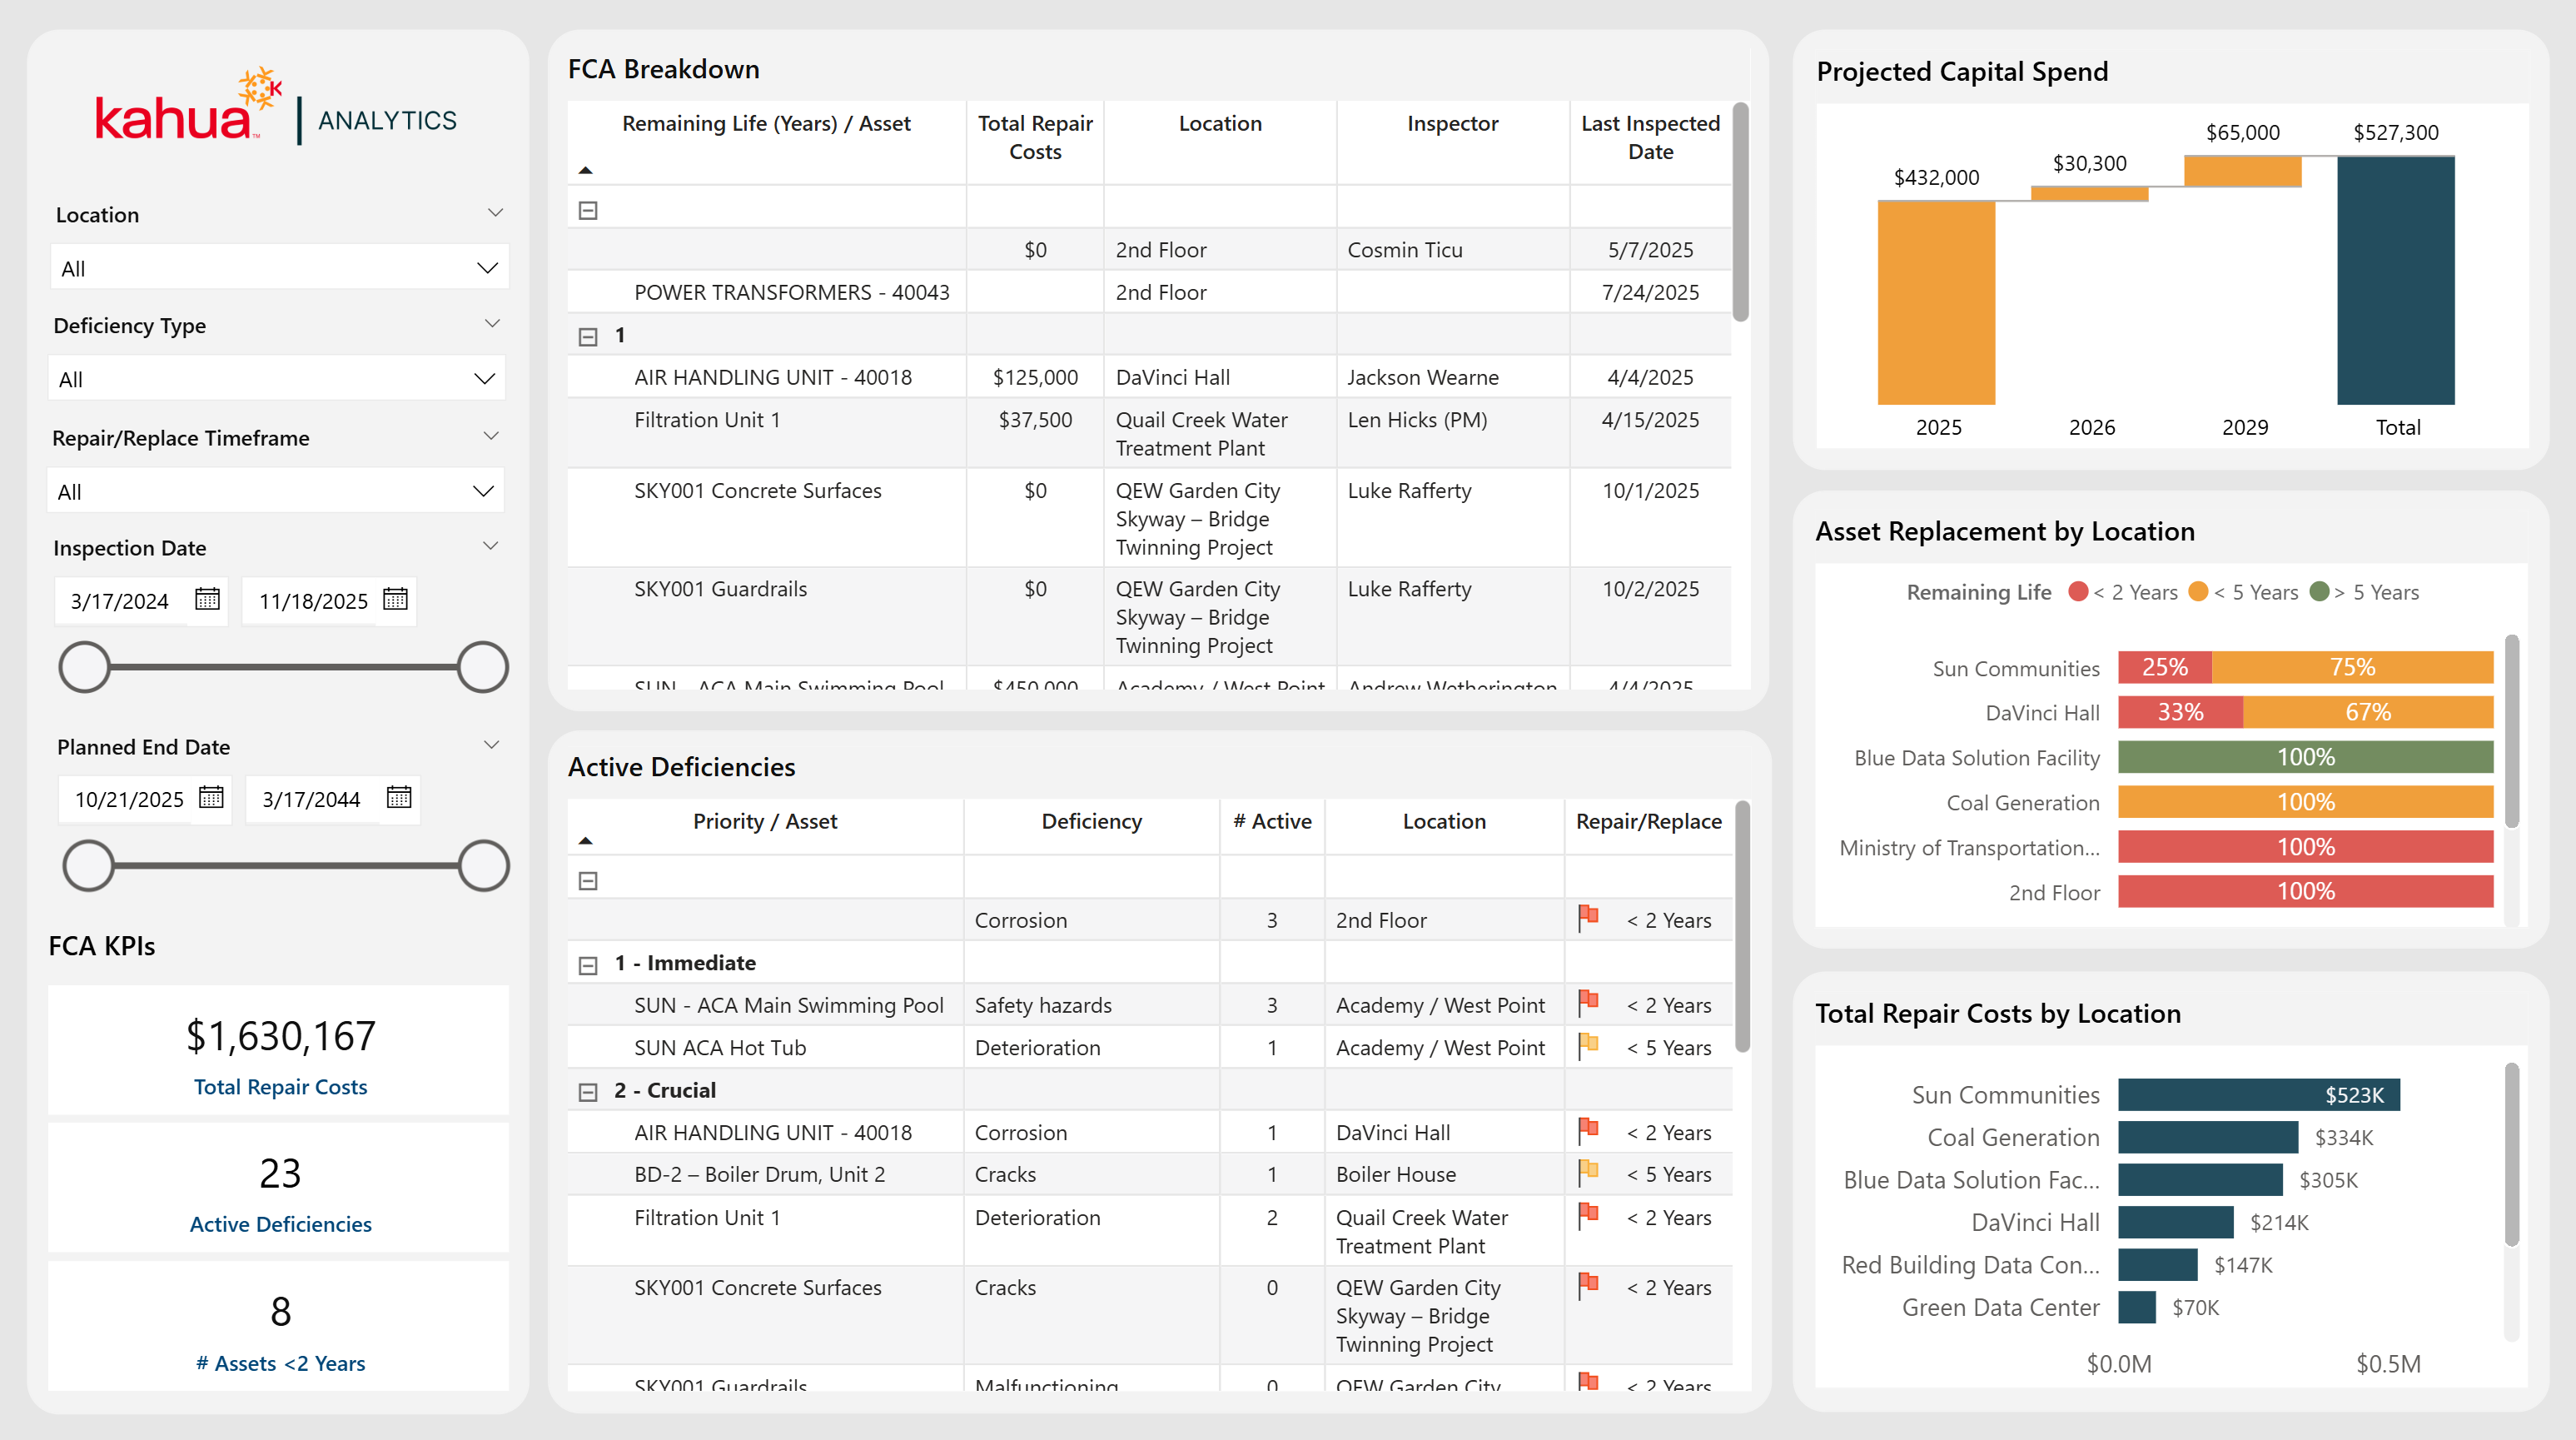
The Field Condition Assessment (FCA) Summary Dashboard helps owners make decisions on when - and if - to replace assets. The data is based off the findings from conducted FCAs. Visuals showcase FCA Breakdown, projected capital spending, repair costs by location, and more.
Description
This dashboard focuses on the live reporting of immediate, high-priority items based on the results of FCAs. These reports cover the entirety of the program ecosystem. It can be staged historically, if needed.
Problem
Without a clear picture of FCA results in relation to existing assets, it is difficult to accurately pin-point which assets must be replaced.
Benefit
With this dashboard, owners can easily find the assets in need of replacement. This is particularly true for those of high priority. With dynamic, cross-sectional analytics, users can gain instant, high-latency insights.
The following apps are necessary to utilize this dashboard:
-
Facility Condition Assessments
Example of the Dashboard Interface
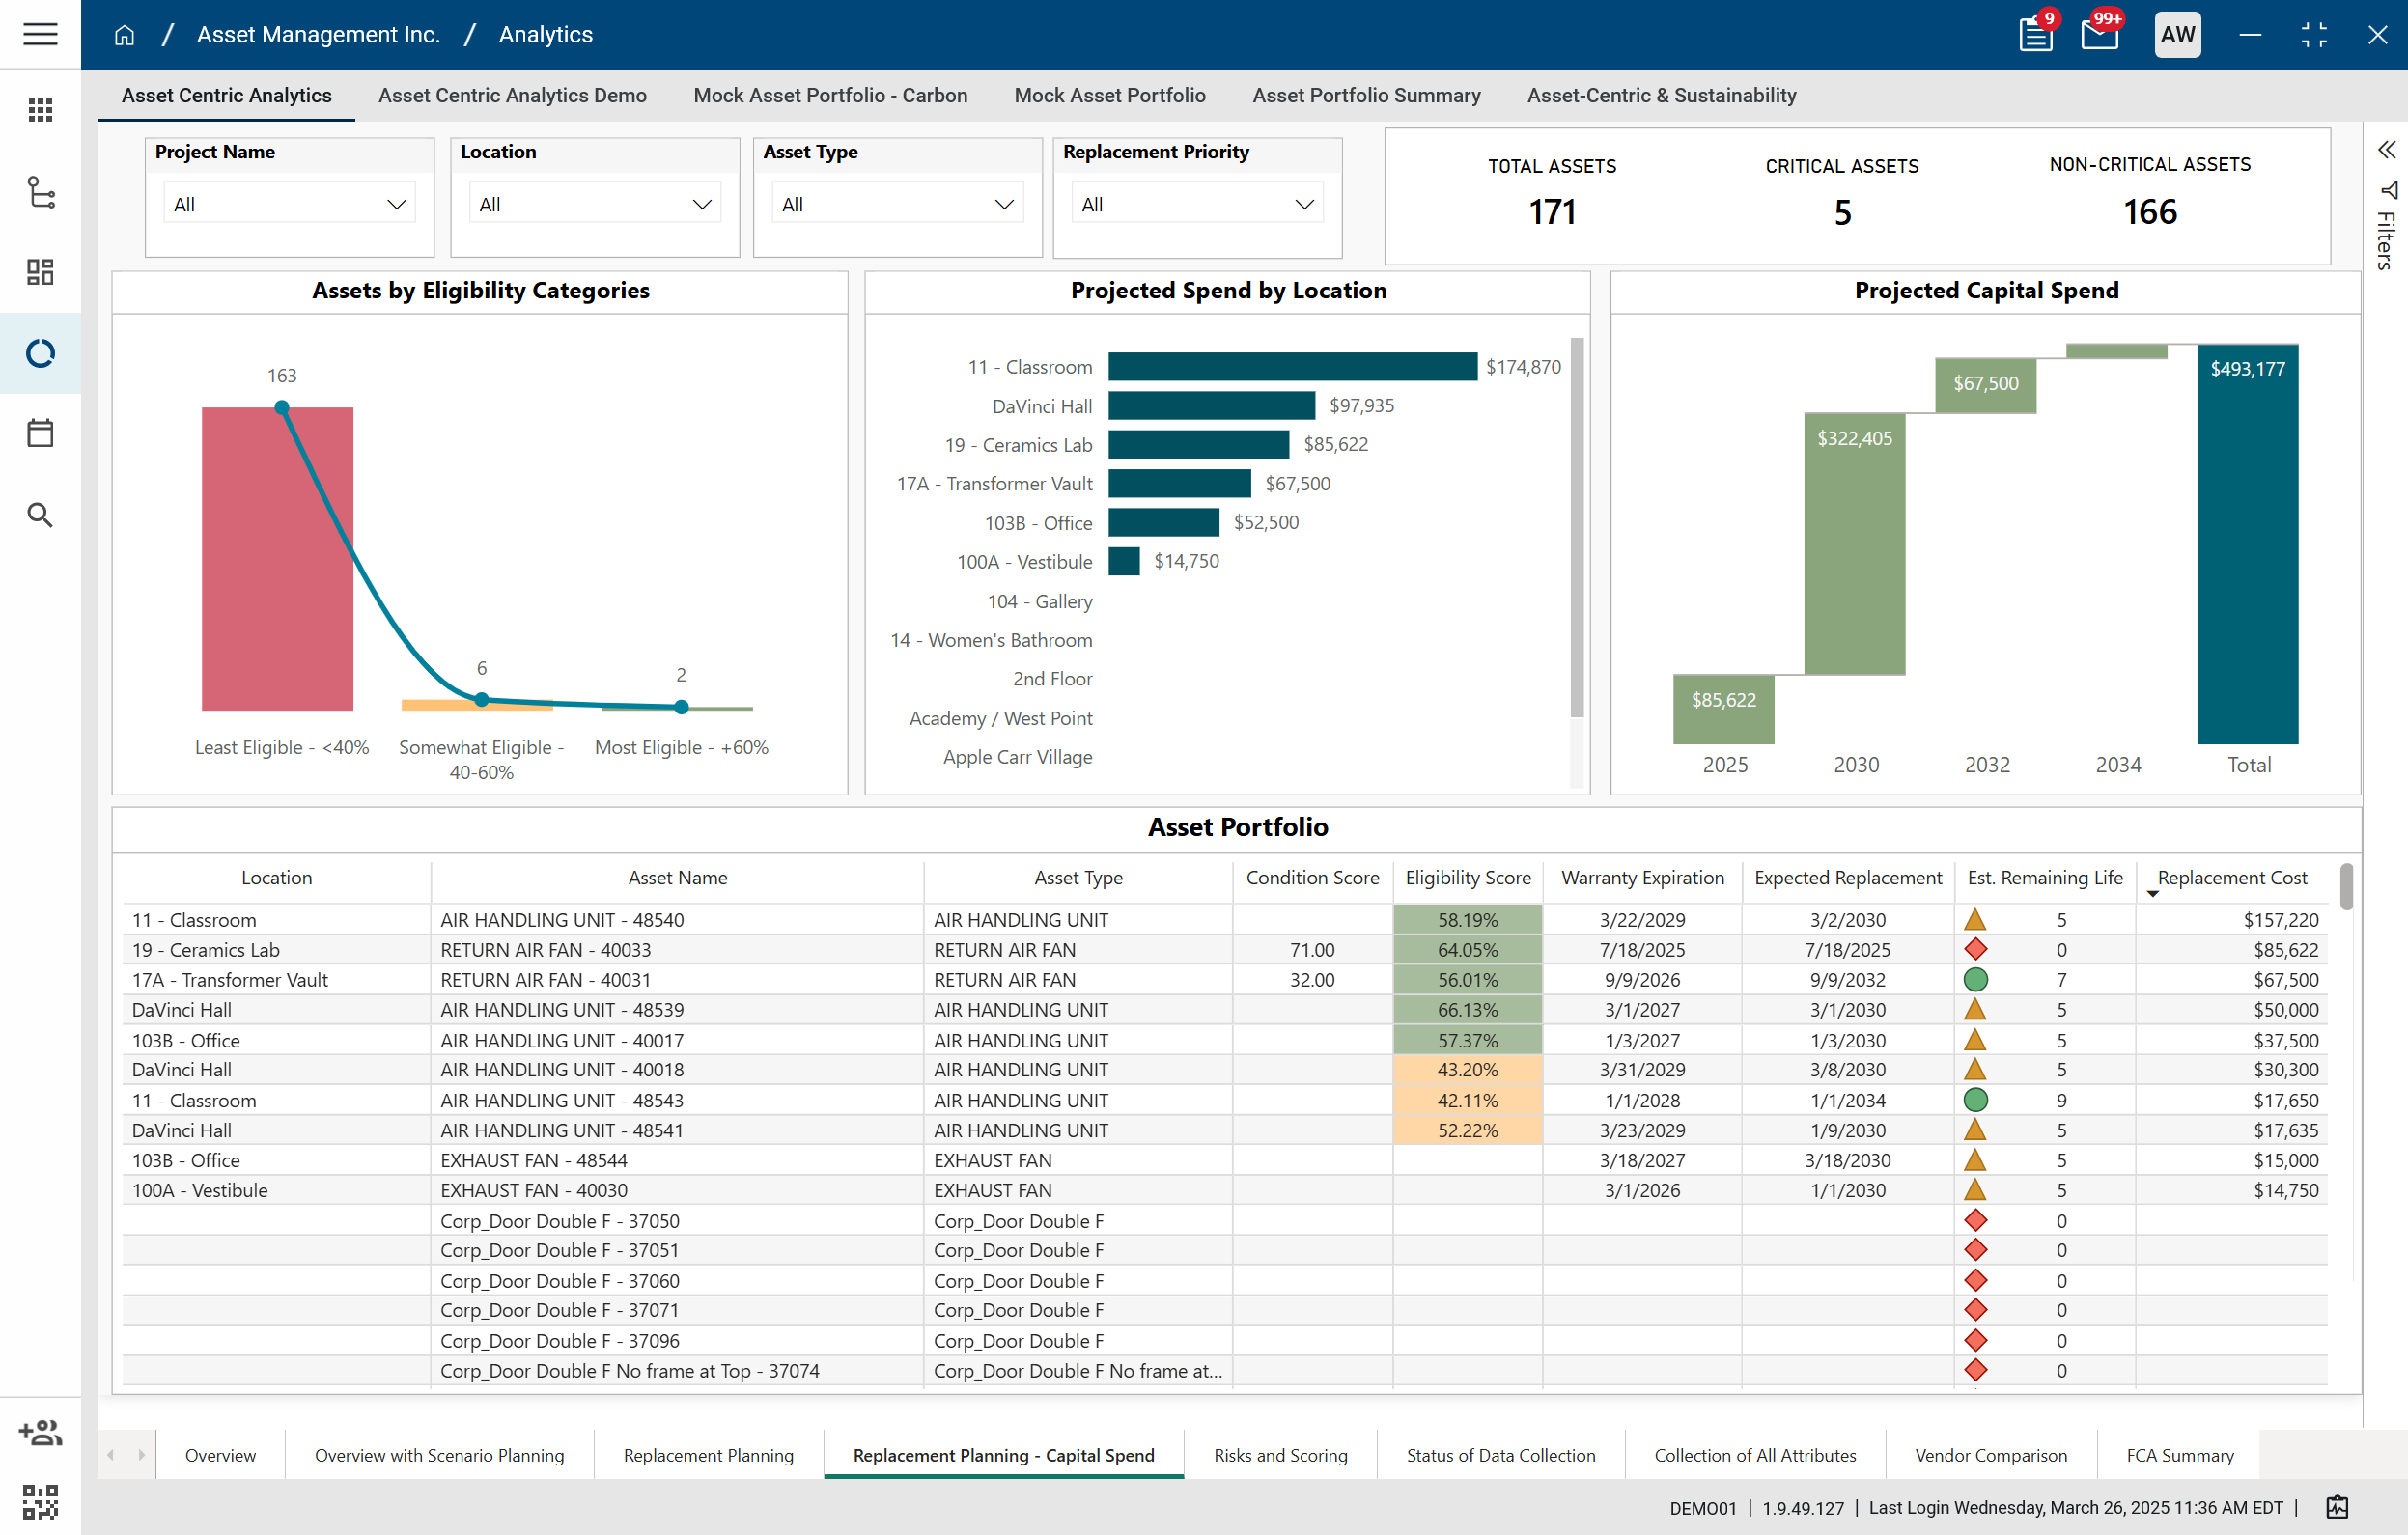
The Replacement Planning – Capital Spend Dashboard provides key insights into projected capital expenditures for asset replacements. Leveraging financial data, asset attributes, and timeline-based metrics, this dashboard enables users to effectively plan, prioritize, and allocate capital resources across their domain.
Description
With this dashboard, users can clearly view an overview of their asset portfolio and how it relates to capital spending. Thus, they are made aware of the number of assets they manage and their locations, as well the projected capital spending associated with them.
Problem
Keeping track of assets and the capital spending associated with them is essential for planning and prioritization. Without this, users can lack a clear view of their projected budget in relation to their assets.
Benefit
With this dashboard, users can monitor the projected capital spending, asset scoring, and eligibility categories. Thus, they can properly plan for the future of their spending and asset management.
The following apps are necessary to utilize this dashboard:
-
Asset Definition
-
Asset Manager
-
Locations
-
Project
Example of the Dashboard Interface