Kahua Analytics General Contractor Package
Applicable Packages This article applies to the Kahua for General Contractors package. If you are not sure if this is relevant to you, please contact your domain administrator.
The Kahua Analytics for General Contractors Package offers a suite of dashboards designed to help users monitor project portfolios, manage field operations, track financial performance, and oversee construction activities across multiple projects.
Detailed descriptions of each dashboard can be found below.
The General Contractor package contains two categories of dashboards. Portfolio Analysis dashboards display information across multiple projects within the selected portfolio, while Project Snapshot dashboards display detailed information for the selected project.
Dashboard Categories
The General Contractor package is organized into two dashboard categories:
-
Portfolio Analysis — Analytical views across multiple projects within the selected portfolio. They help users monitor project health, evaluate financial performance, identify operational trends, and compare performance across projects.
-
Project Snapshot — Detailed, action-oriented views of project management applications within the selected project. They help project teams monitor day-to-day activity, manage outstanding work, and quickly identify records requiring follow-up.
Portfolio Analysis
Portfolio Analysis dashboards provide high-level visibility into the overall state of the project portfolio. They are designed for users who need to evaluate project health, financial performance, and operational activity across all active projects.
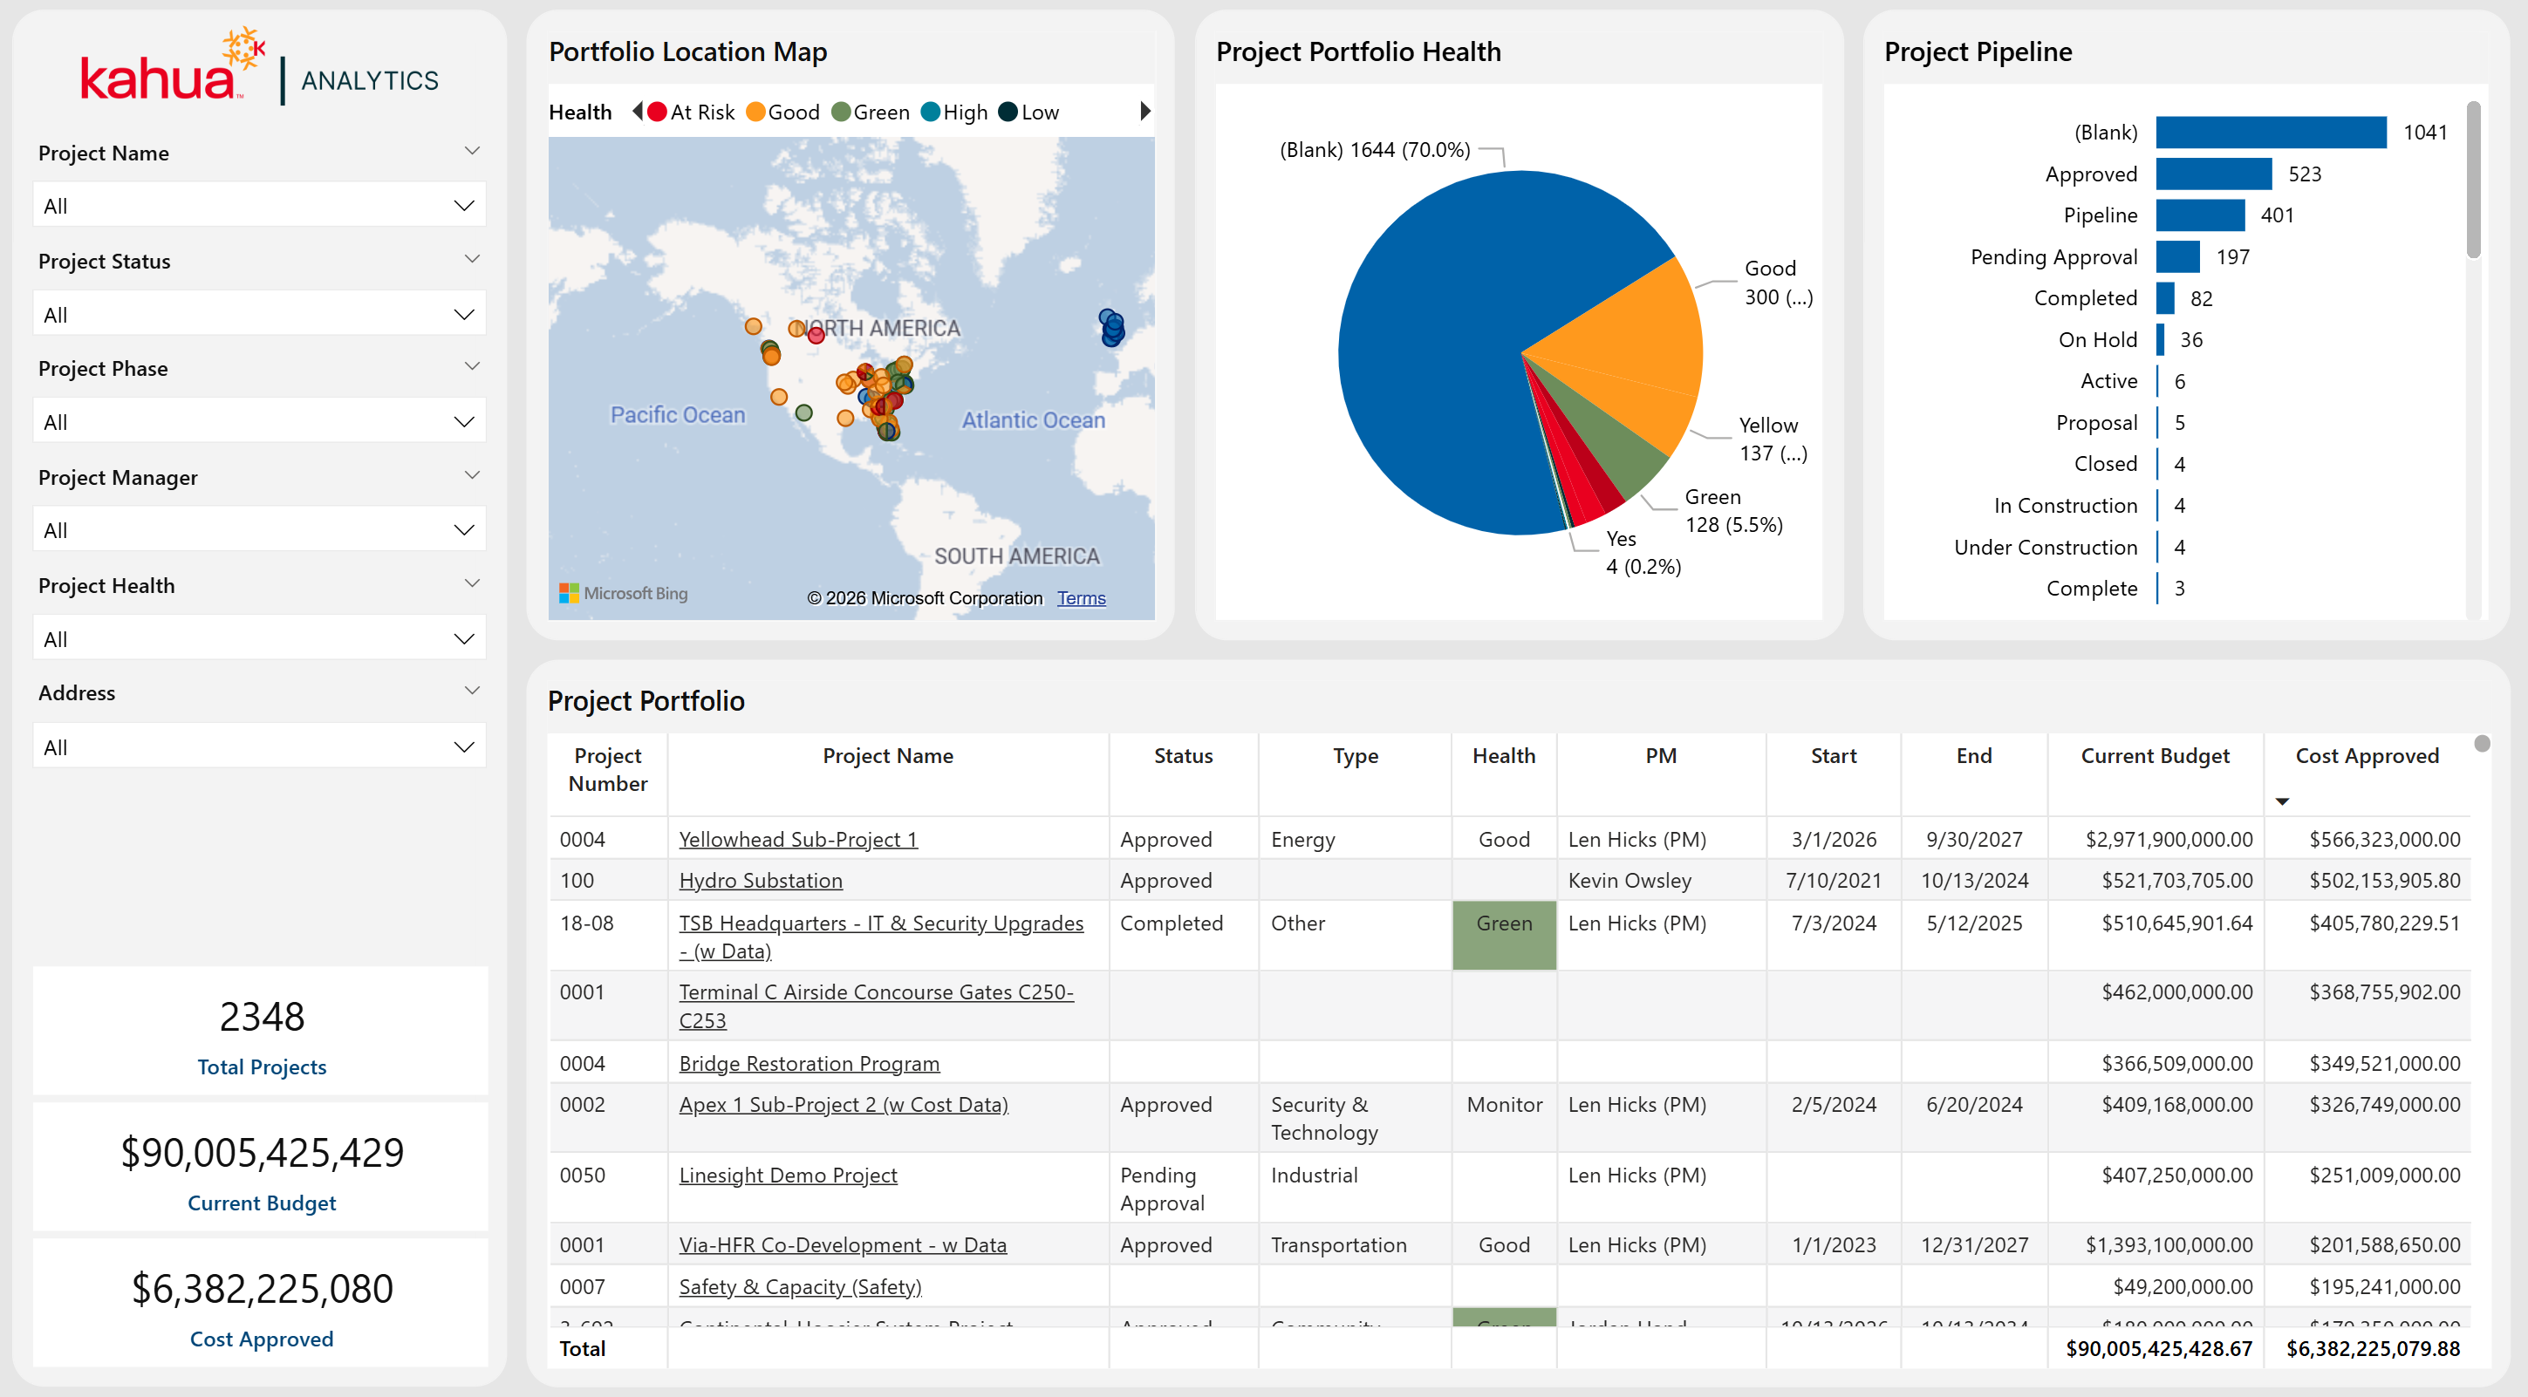
 Project General Portfolio
The Project General Portfolio dashboard provides a high-level overview of all active projects across the portfolio. It surfaces key financial metrics, project health, status, and geographic distribution, to help users identify projects requiring attention.
Description
Aggregates project budgets, commitments, health, status, and location into a single portfolio-level view.
Problem
Managing numerous projects simultaneously makes it difficult to identify operational issues. Without a centralized view, important trends can be overlooked.
Benefit
By consolidating portfolio data into one dashboard, users can evaluate overall health and drill into project-specific details for informed decision-making.
Required Kahua Applications
-
Addresses
-
Contacts
-
Companies
-
People
-
Portfolio Manager
-
Properties
-
Work Breakdown
Out of the Box Dashboard Interface
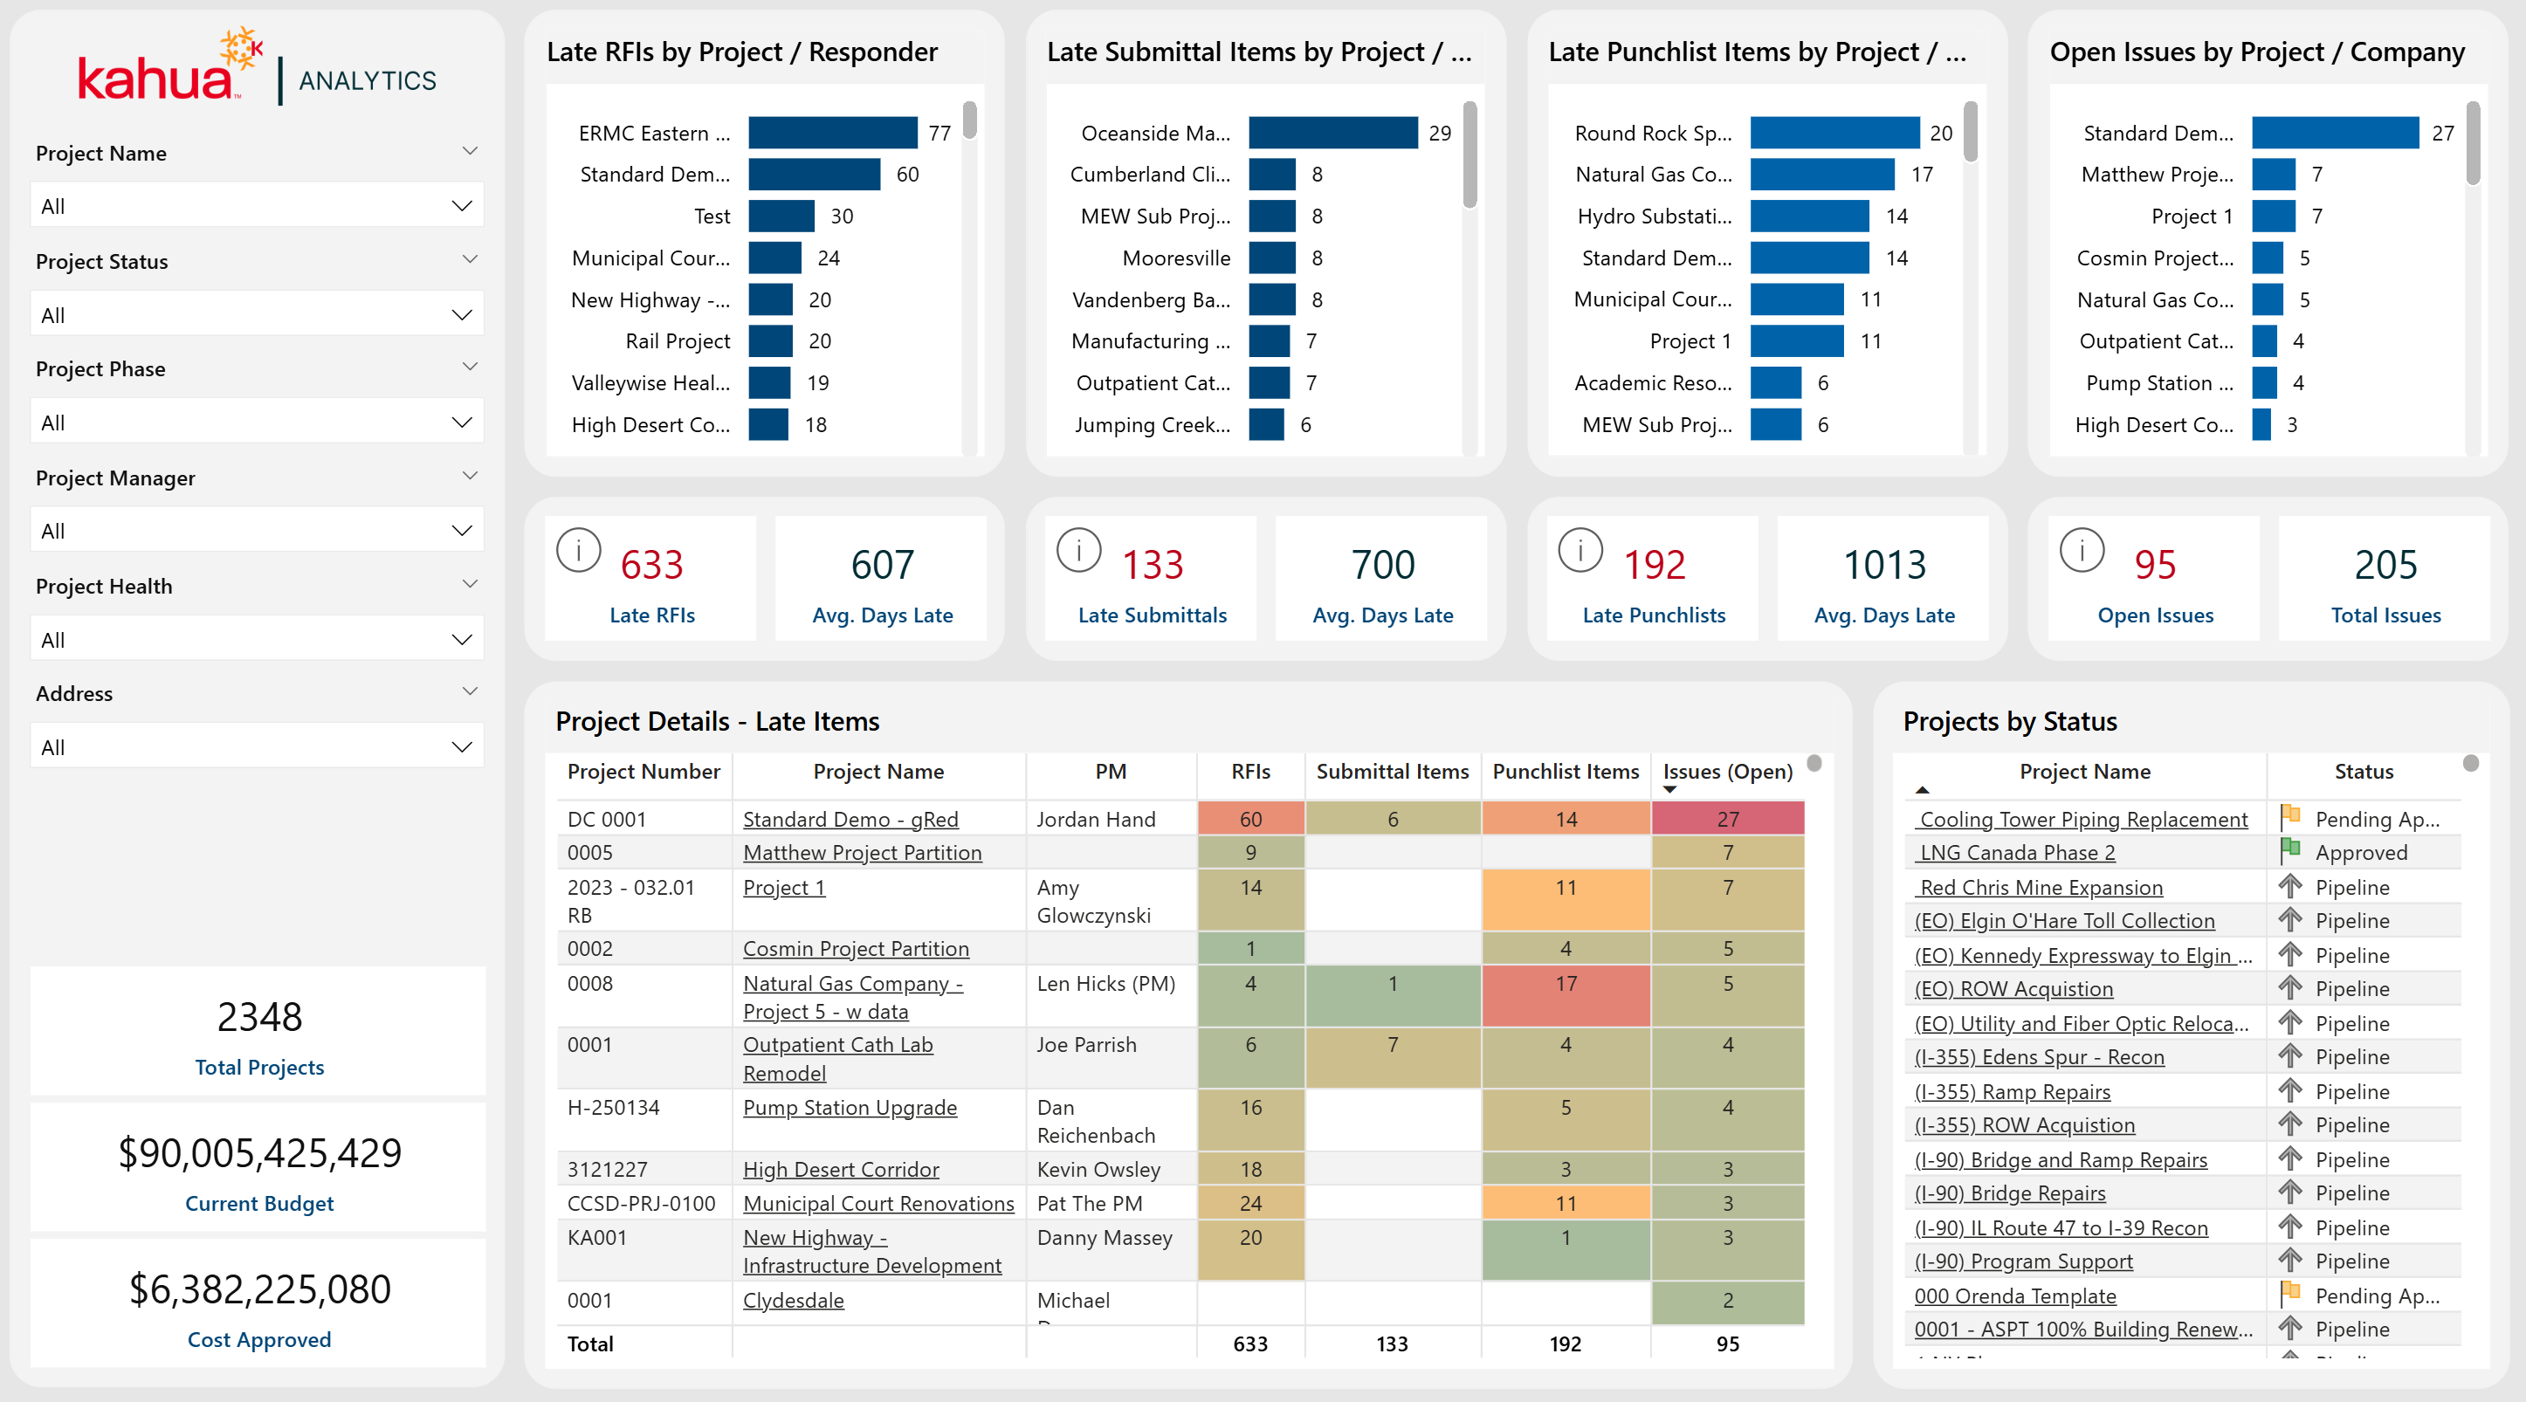
Project Performance
The Project Performance dashboard surfaces overdue and at-risk work across RFIs, Submittals, Punch Lists, and Issues at the portfolio level. It helps users identify projects requiring immediate attention.
Description
Summarizes late and at-risk records from multiple field applications to highlight overdue work and response performance across the portfolio.
Problem
Identifying overdue work across multiple applications becomes difficult at scale. Without centralized visibility, delayed responses can impact schedules and budgets.
Benefit
By surfacing late and at-risk records in a single view, users can prioritize critical work and reduce schedule impacts before they escalate.
Required Kahua Applications
-
Addresses
-
Issues
-
Portfolio Manager
-
Punch Lists
-
RFIs
-
Submittals (Submittal Items)
-
Work Breakdown
Out of the Box Dashboard Interface
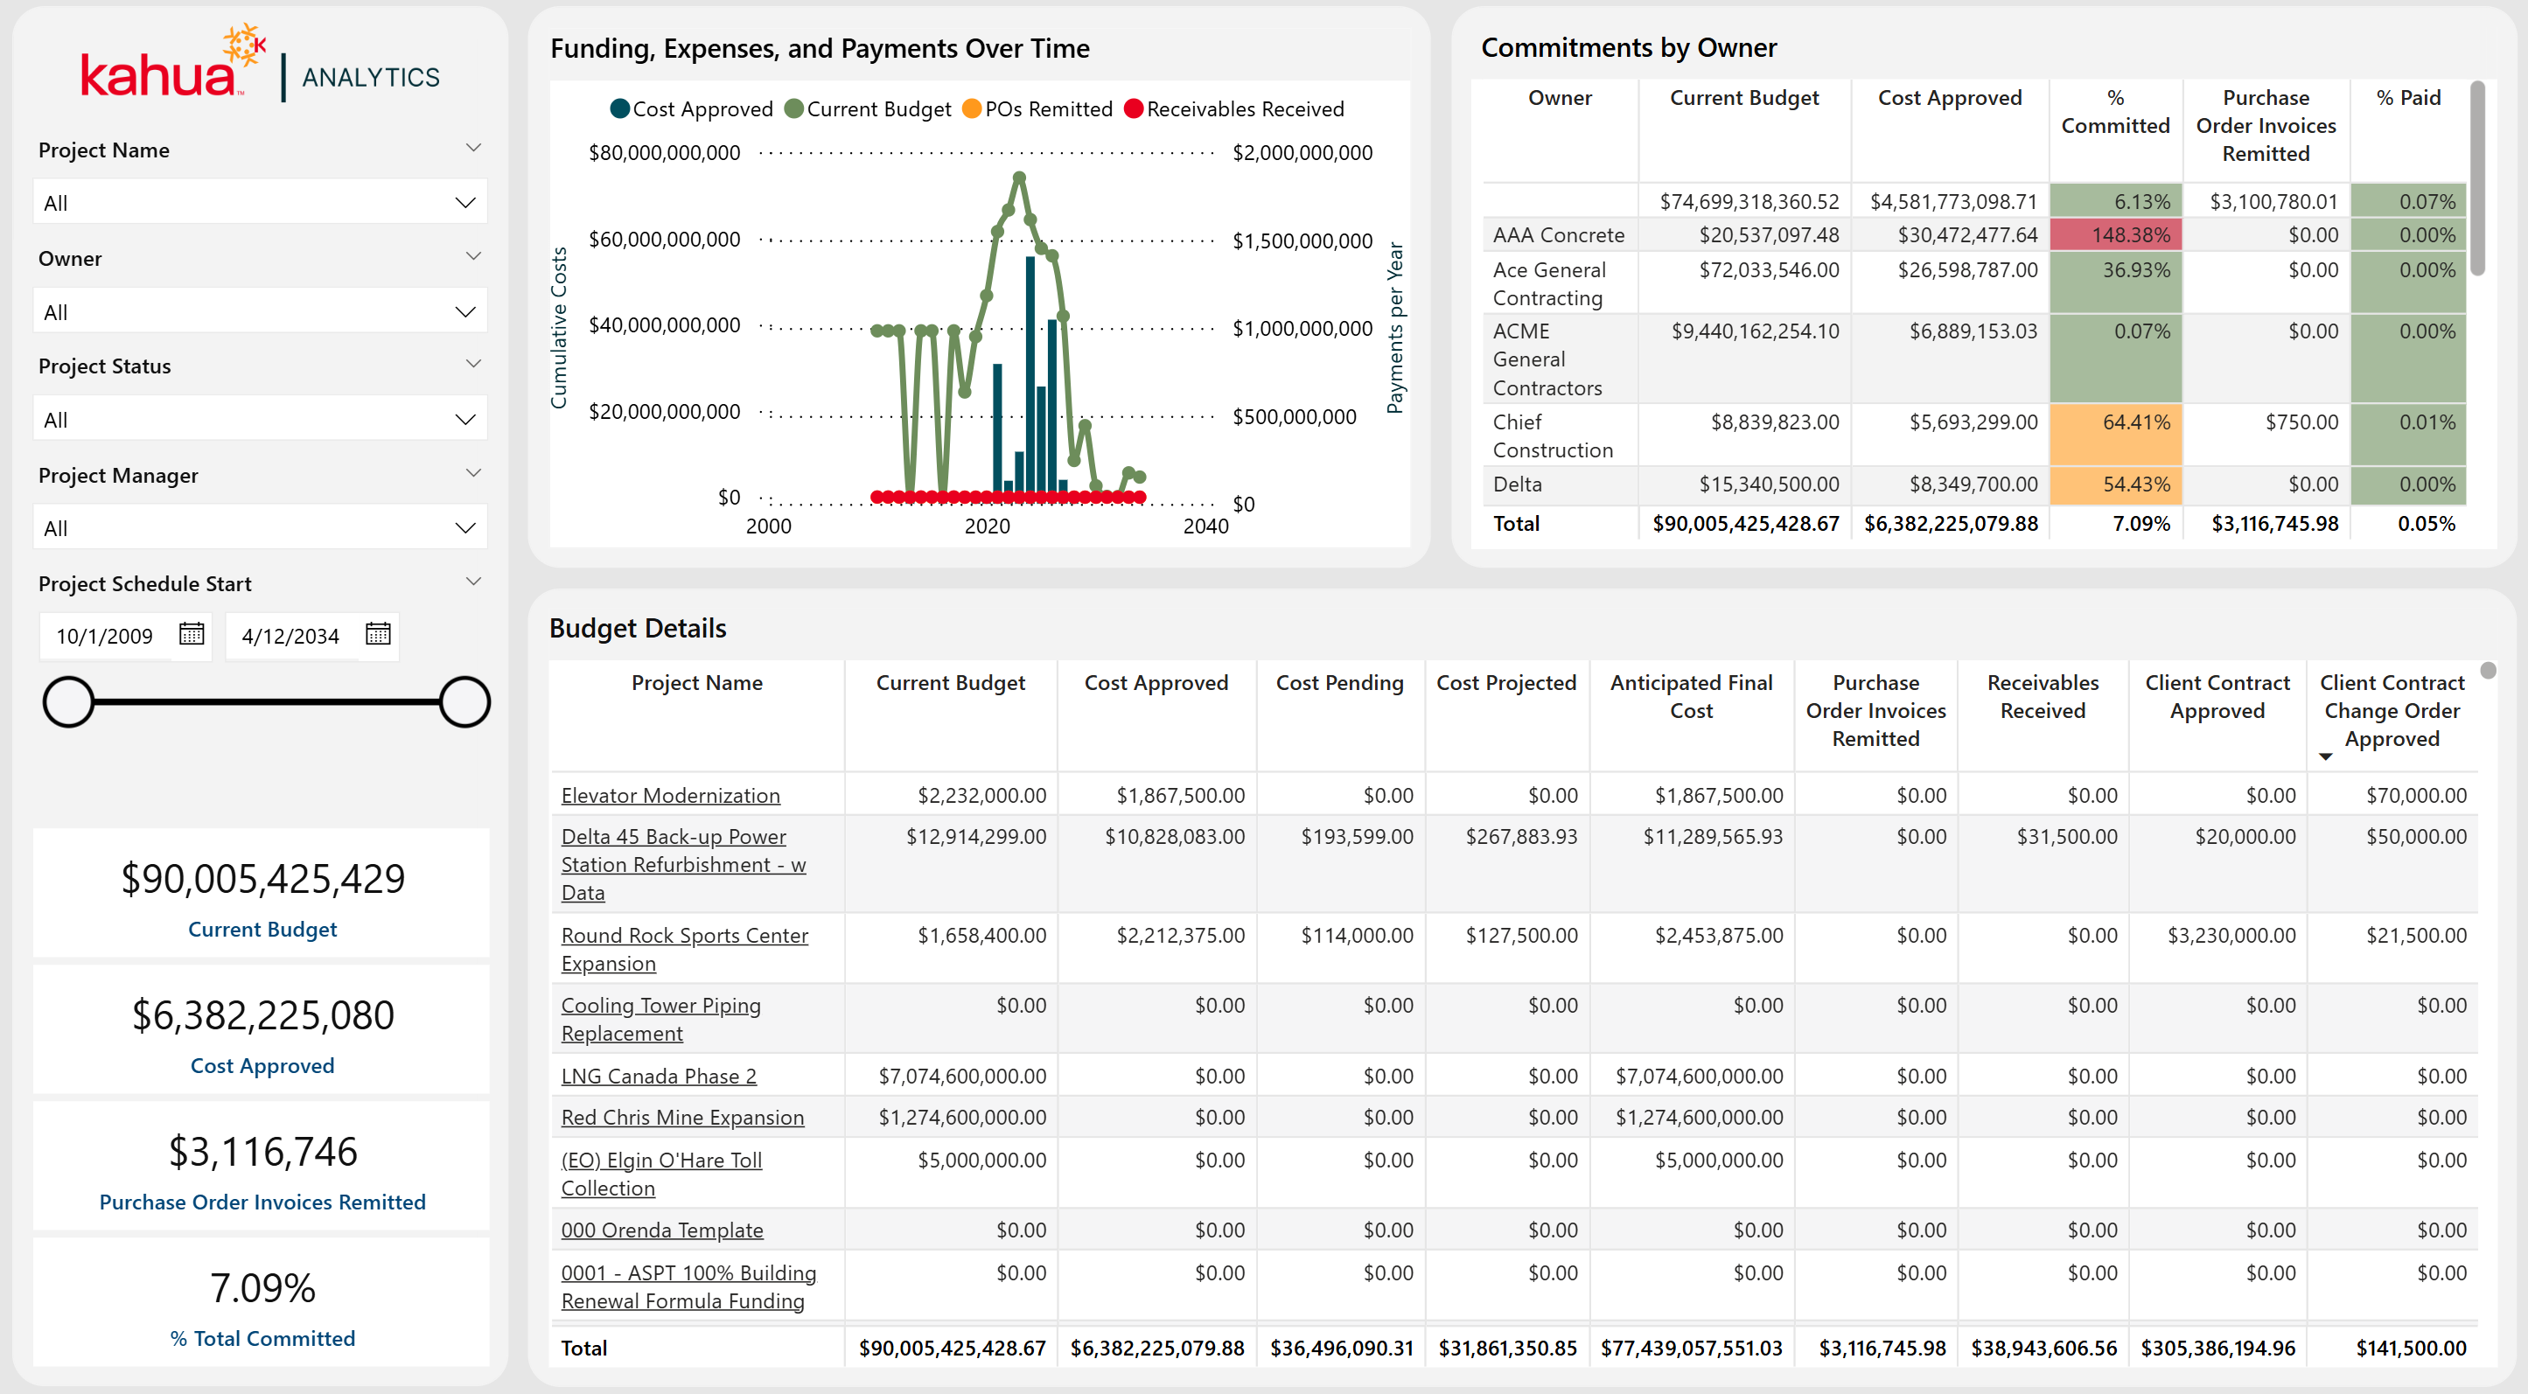
Budget Insights
The Budget Insights dashboard offers a high-level view of project financial health across the portfolio. It surfaces current budgets, commitments, payments, and remaining available funds.
Description
Summarizes current budgets, commitments, payments, and overall financial performance across the portfolio.
Problem
Without a consolidated financial view, budget overruns and payment delays can go unnoticed until they create larger issues.
Benefit
By centralizing financial metrics with project-level breakdowns, users can monitor budget adherence and track payment progress.
Required Kahua Applications
-
Portfolio Manager
-
Work Breakdown
Out of the Box Dashboard Interface
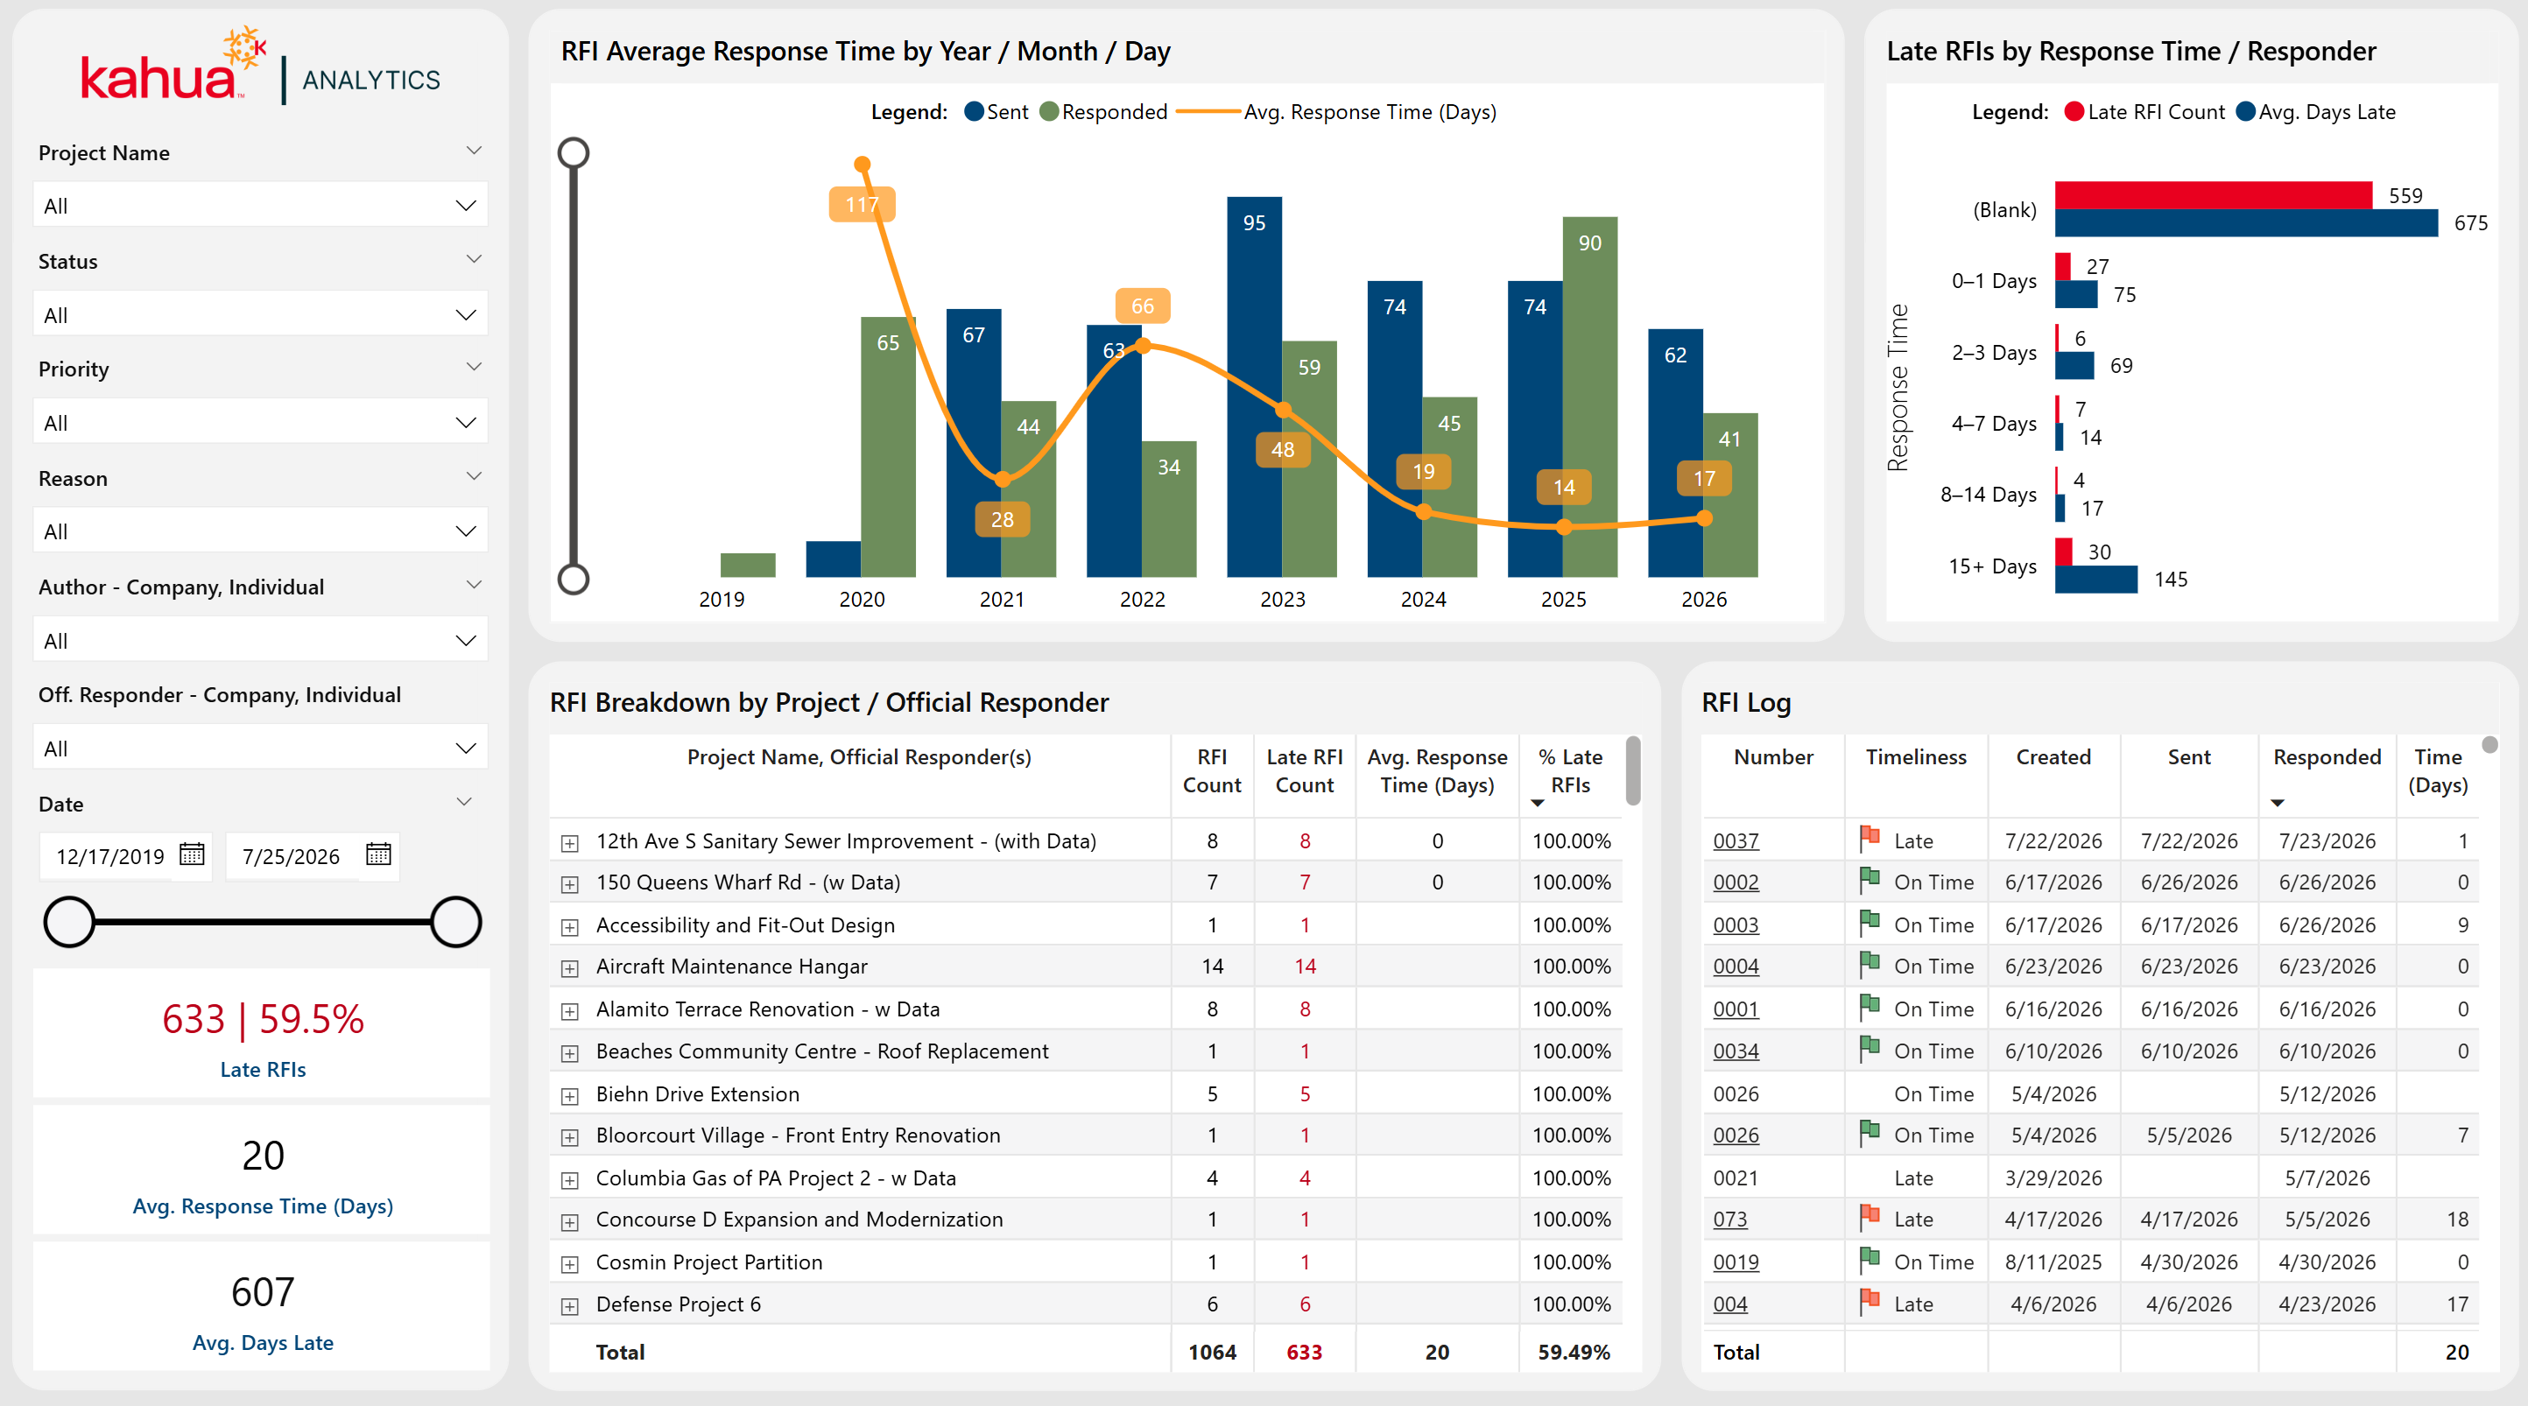
RFI Trend Analysis
The RFI Trend Analysis dashboard tracks RFI communication activity, response performance, and trends across the portfolio. It helps users evaluate how effectively official responders are managing RFIs over time.
Description
Surfaces response time trends, responder performance, and communication patterns that may indicate process bottlenecks.
Problem
RFI communication across multiple projects is difficult to monitor at scale. Without visibility into response times, delays can cascade into schedule and cost impacts.
Benefit
By tracking response data with trend analysis, users can improve accountability and address process issues before they impact timelines.
Required Kahua Applications
-
Portfolio Manager
-
RFIs
Out of the Box Dashboard Interface
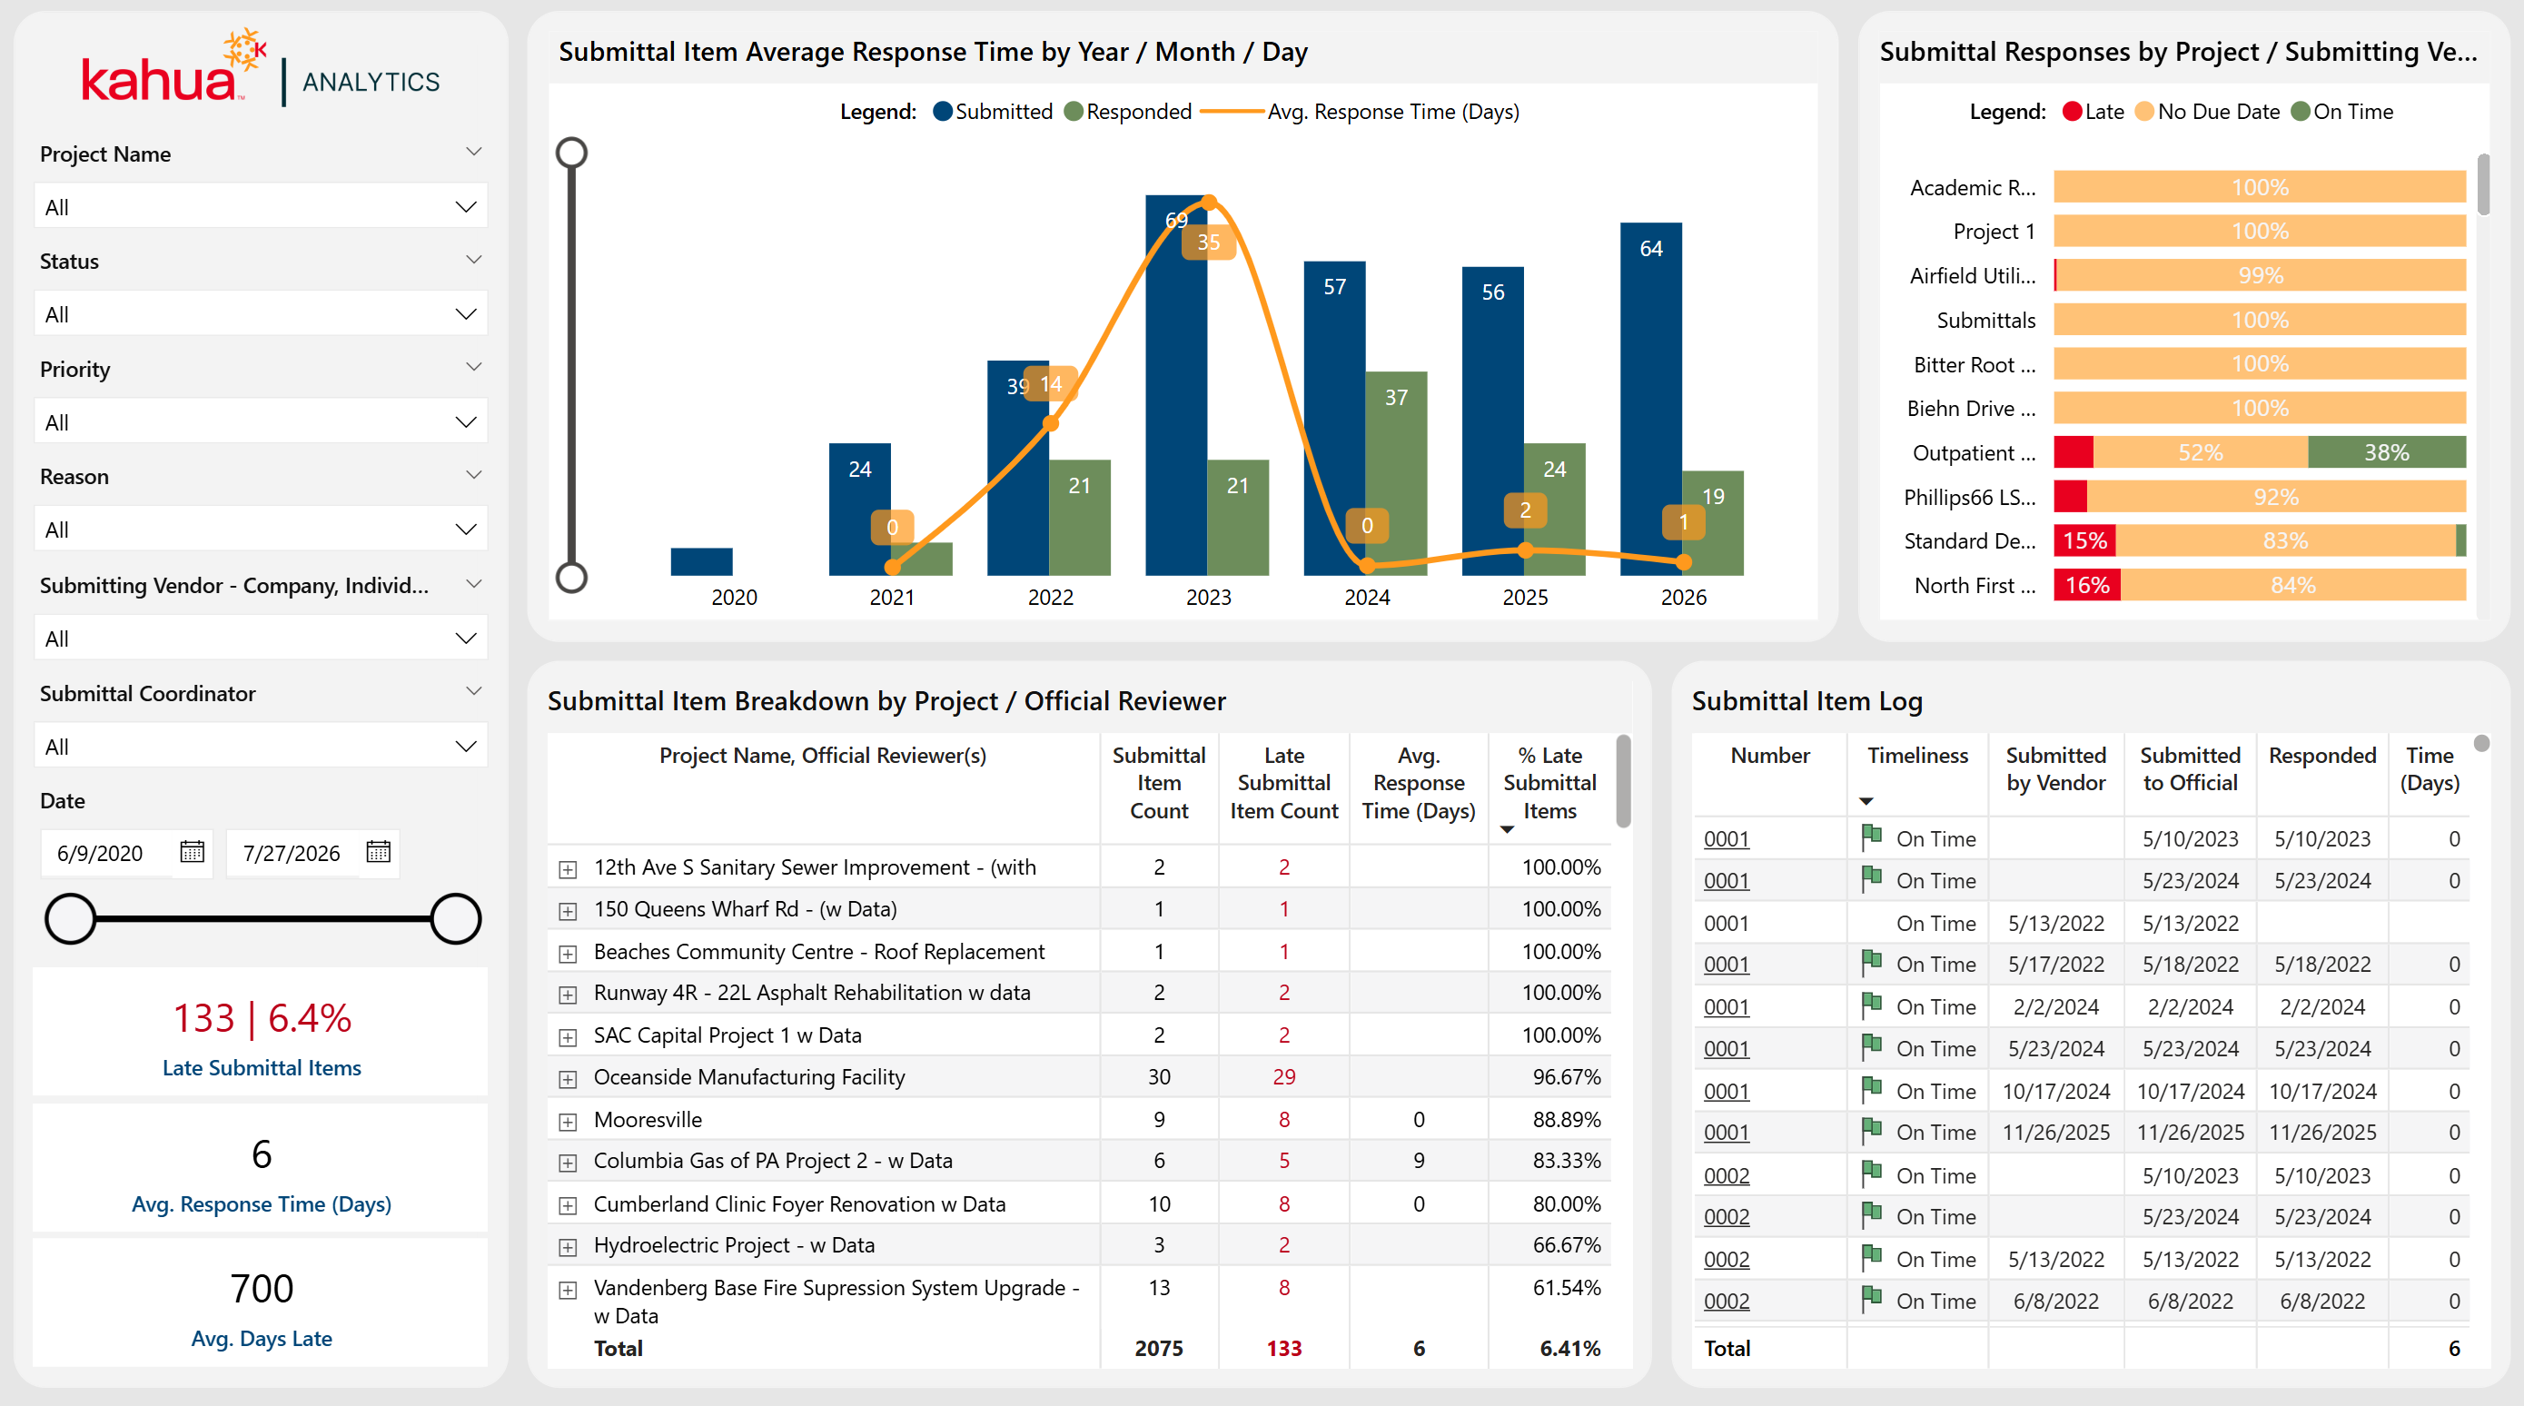
Submittal Trend Analysis
The Submittal Trend Analysis dashboard tracks submittal review activity, vendor performance, and trends across the portfolio. It helps users evaluate how effectively the review process is progressing over time.
Description
Surfaces review time trends, vendor and coordinator performance, and patterns in the submittal review cycle.
Problem
Coordinating submittal reviews between multiple vendors and reviewers across projects is challenging. Without centralized tracking, review delays can go unnoticed.
Benefit
By tracking submittal data with trend analysis, users can streamline the review process and hold vendors accountable.
Required Kahua Applications
-
Portfolio Manager
-
Submittals (Submittal Items)
Out of the Box Dashboard Interface
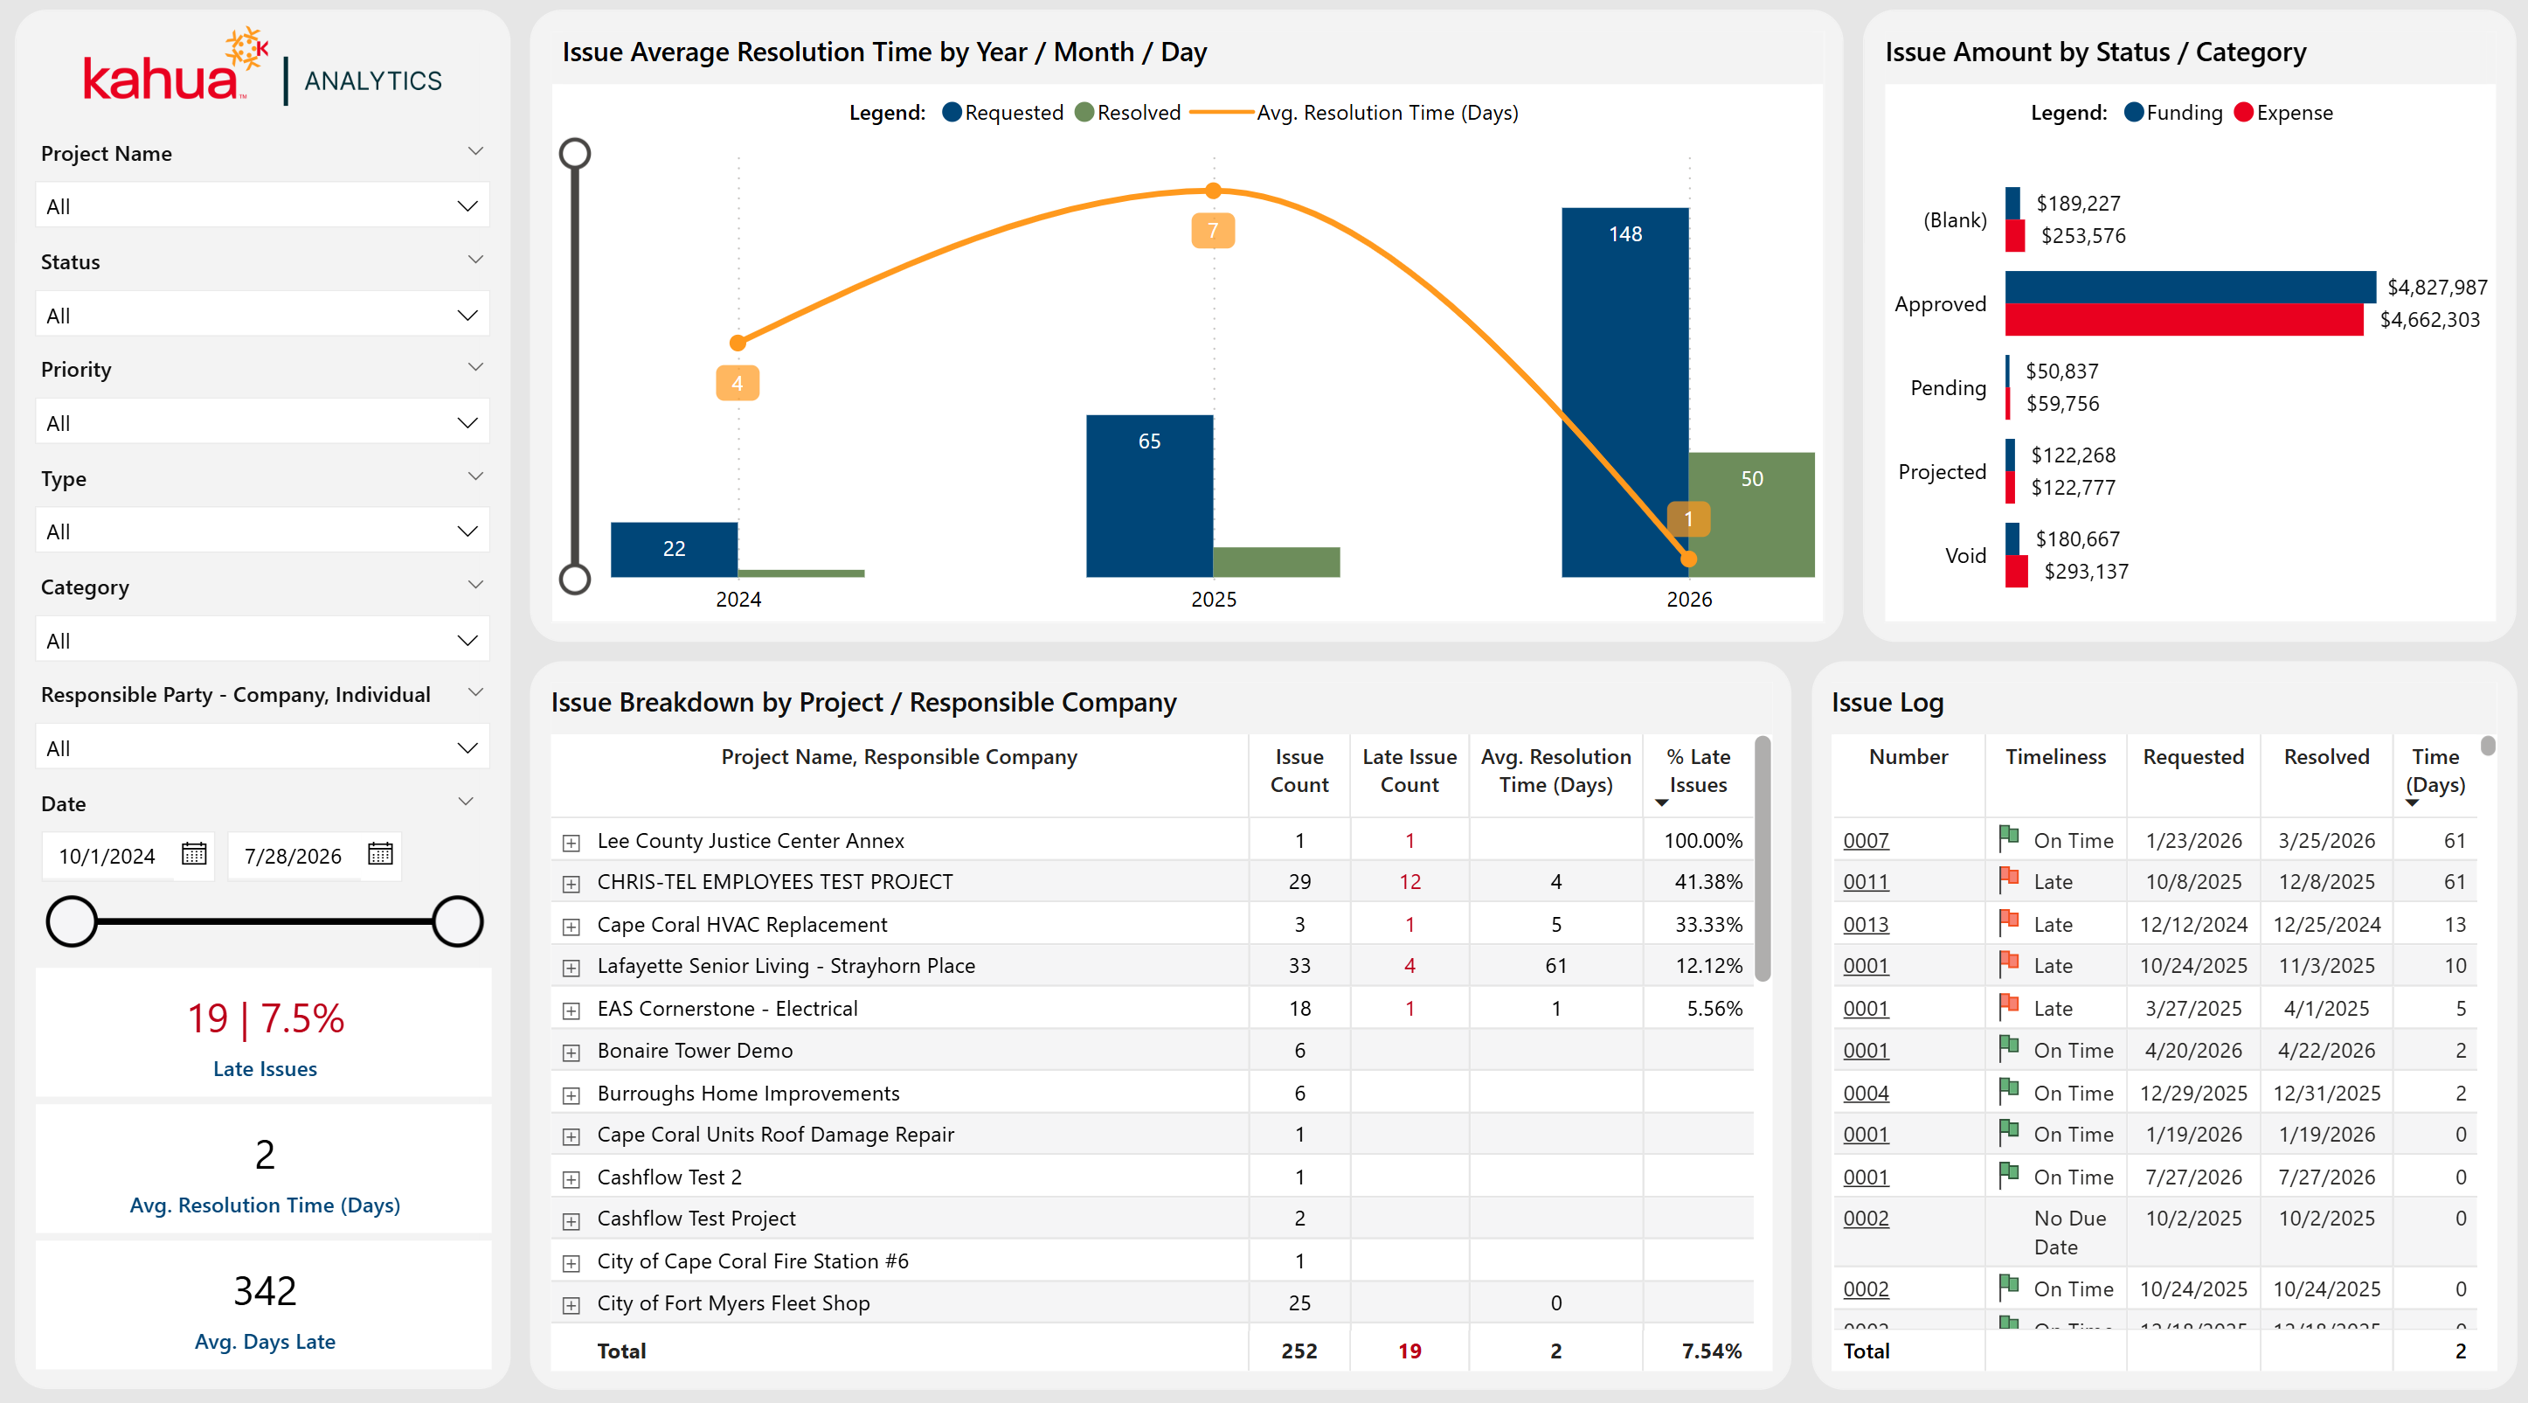
Issue Trend Analysis
The Issue Trend Analysis dashboard tracks issue activity, resolution performance, and financial impact across the portfolio. It helps users evaluate how effectively issues are being prioritized and resolved over time.
Description
Surfaces resolution time trends, financial exposure, and patterns in issue management across projects.
Problem
Issues accumulate quickly across active construction projects. Without centralized visibility, delayed responses can escalate costs and create schedule disruptions.
Benefit
By tracking issue data with trend analysis, users can prioritize high-impact issues and monitor resolution performance.
Required Kahua Applications
-
Portfolio Manager
-
Issues
Out of the Box Dashboard Interface
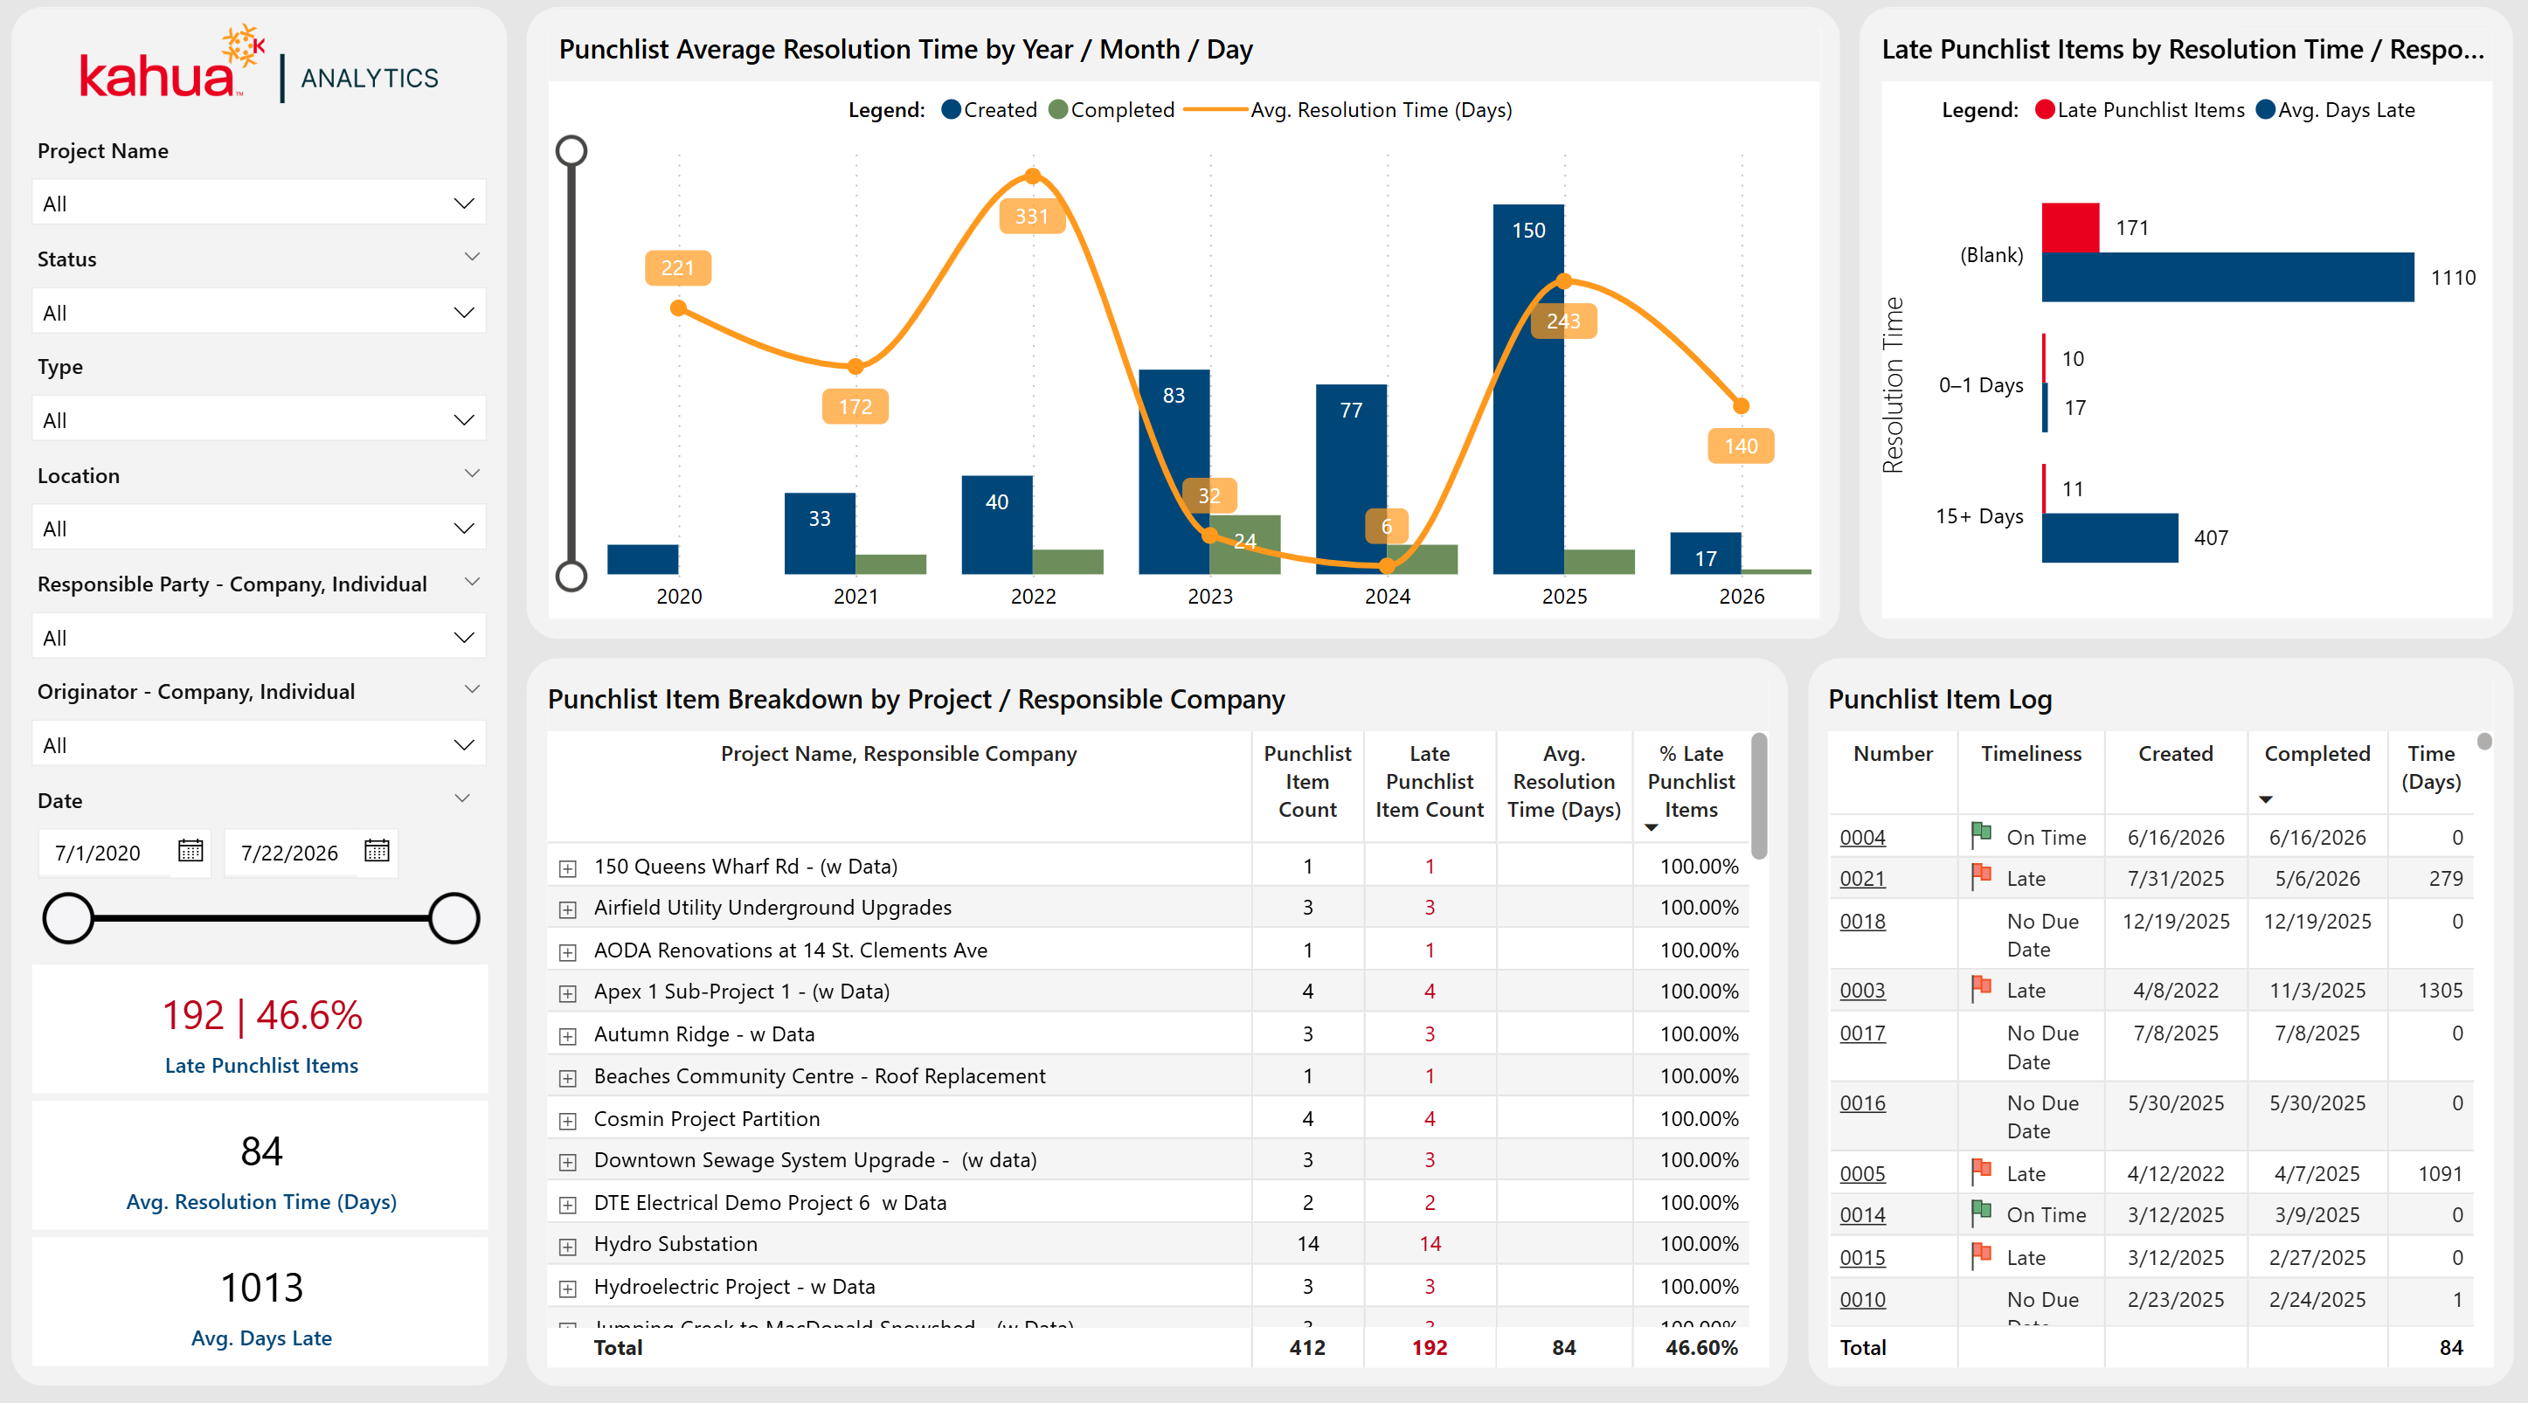
Punch List Trend Analysis
The Punch List Trend Analysis dashboard tracks punch list activity, trade resolution performance, and closeout trends across the portfolio. It helps users evaluate how effectively items are being resolved during closeout.
Description
Surfaces resolution time trends, responsible company performance, and patterns in closeout progress and trade accountability.
Problem
Managing large volumes of punch list items during closeout can be overwhelming. Without visibility into overdue items and responsible trades, closeout timelines can extend significantly.
Benefit
By tracking punch list data with trend analysis, users can prioritize overdue items and monitor resolution performance by trade.
Required Kahua Applications
-
Portfolio Manager
-
Punch Lists
Out of the Box Dashboard Interface
Project Snapshot
Project Snapshot dashboards provide detailed, action-oriented views of project management applications within the selected project. They help project teams monitor day-to-day activity, manage outstanding work, and quickly identify records requiring follow-up.
Project Action Center
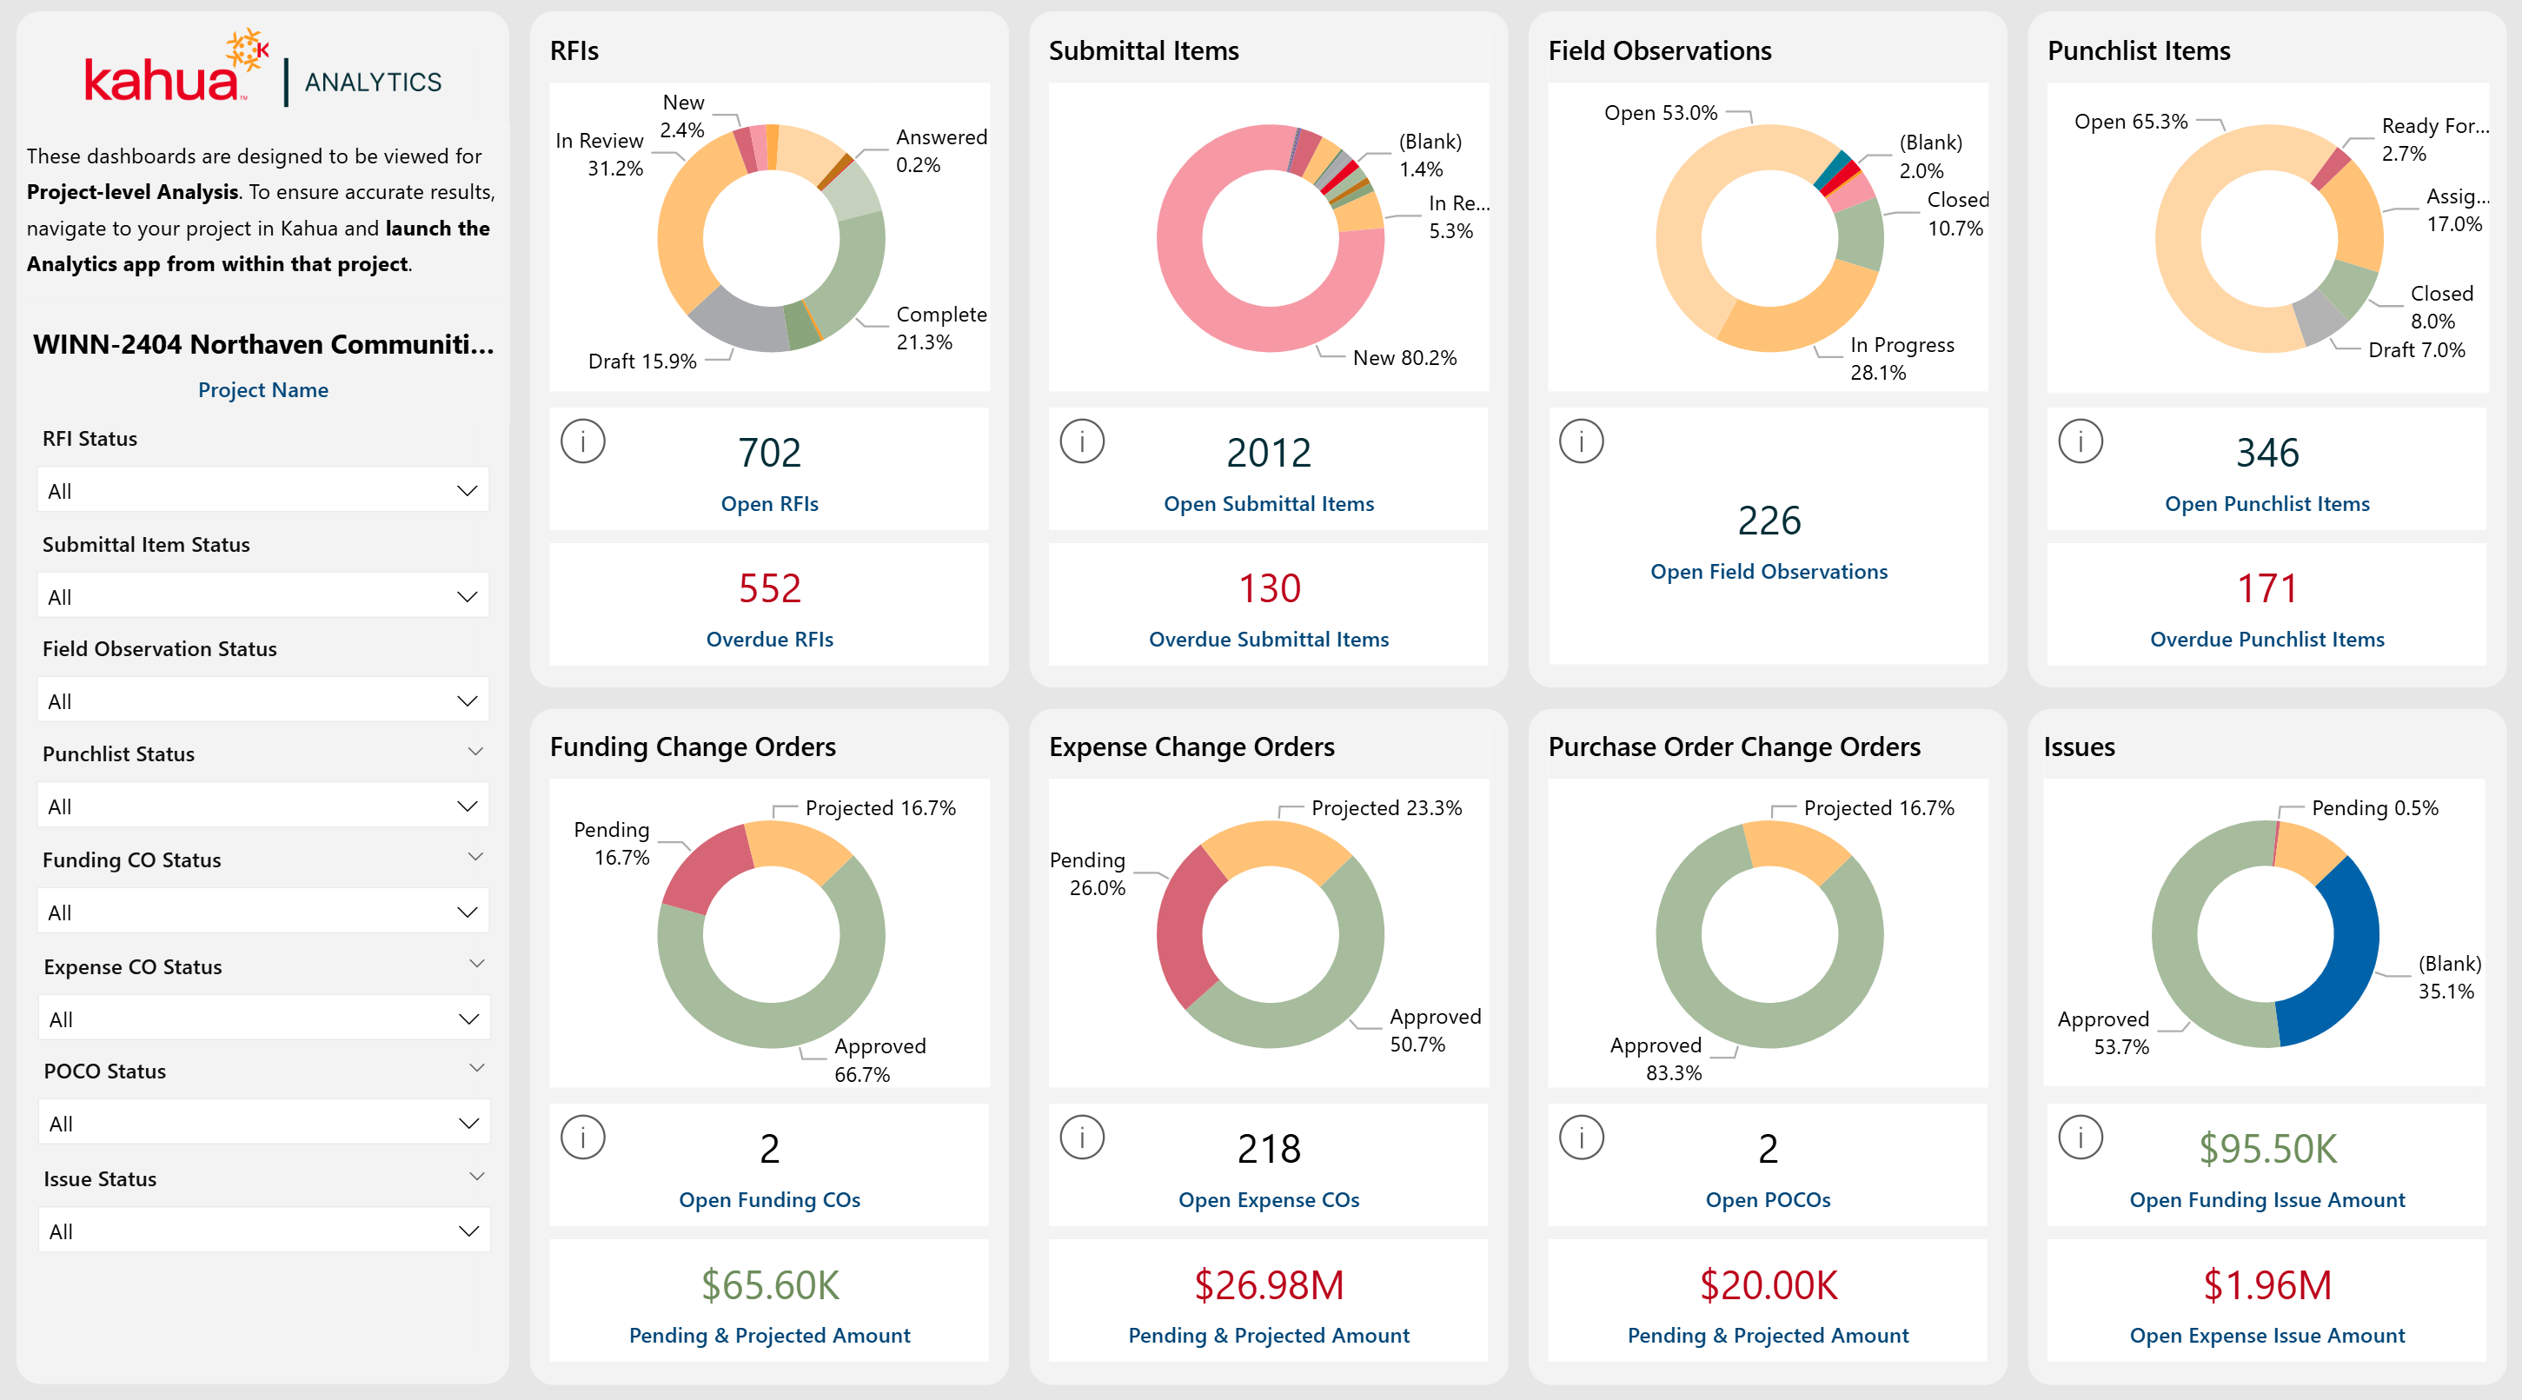
The Project Action Center dashboard summarizes record counts and status distributions for all major applications. Navigation buttons link directly to each application's dedicated dashboard.
Description
Displays where work is accumulating across each application and which areas require follow-up.
Problem
Monitoring each application individually makes it difficult to identify outstanding work. Without a centralized hub, operational visibility is reduced.
Benefit
By organizing all workflows into a single dashboard, users can rapidly assess activity, identify bottlenecks, and navigate to areas requiring investigation.
Required Kahua Applications
-
Expense Change Orders
-
Field Observations
-
Funding Change Orders
-
Issues
-
Portfolio Manager
-
Punch Lists
-
Purchase Order Change Orders
-
RFIs
-
Submittals (Submittal Items)
Out of the Box Dashboard Interface
RFIs
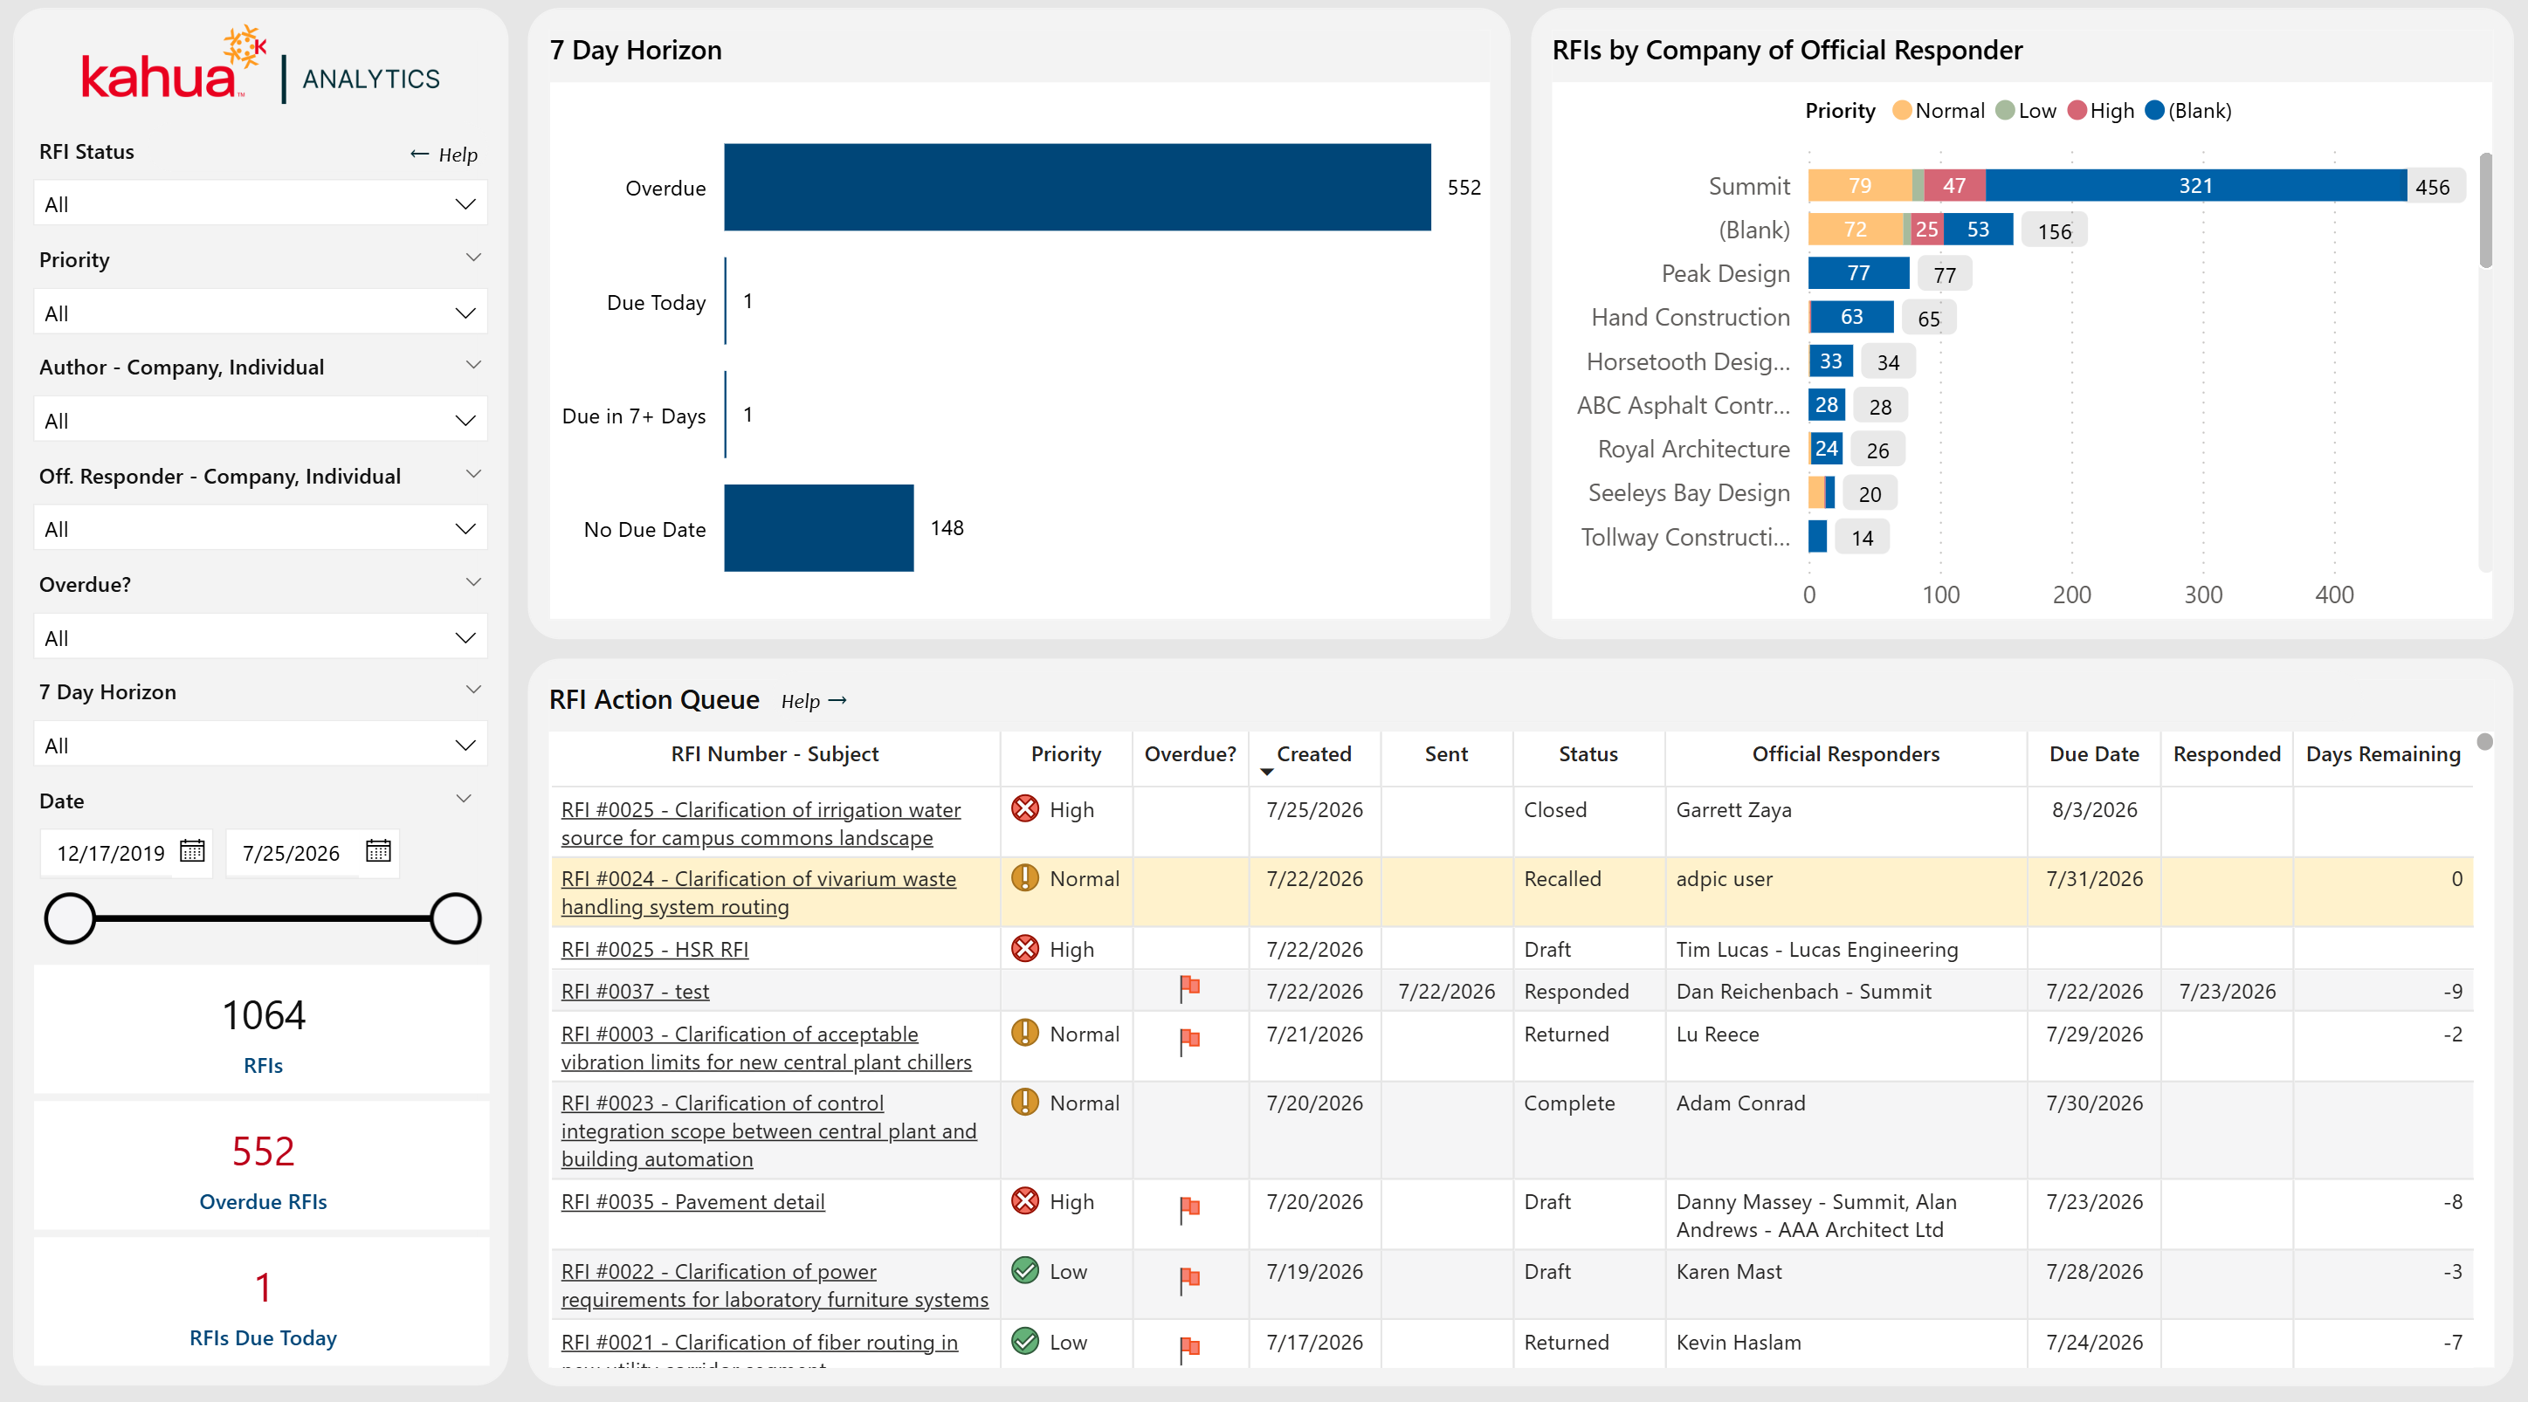
The RFIs dashboard tracks open RFI items, due dates, responsible parties, and overdue indicators for the selected project.
Description
Tracks open RFIs by responder and due date, helping users monitor response times and identify outstanding items.
Problem
Construction projects generate numerous RFIs throughout their lifecycle. Without a centralized view, it can be difficult to identify which requests require immediate attention.
Benefit
By centralizing RFIs with deadlines and responsible parties, users can ensure timely responses and minimize delays.
Required Kahua Applications
-
Portfolio Manager
-
RFIs
Out of the Box Dashboard Interface
Submittals
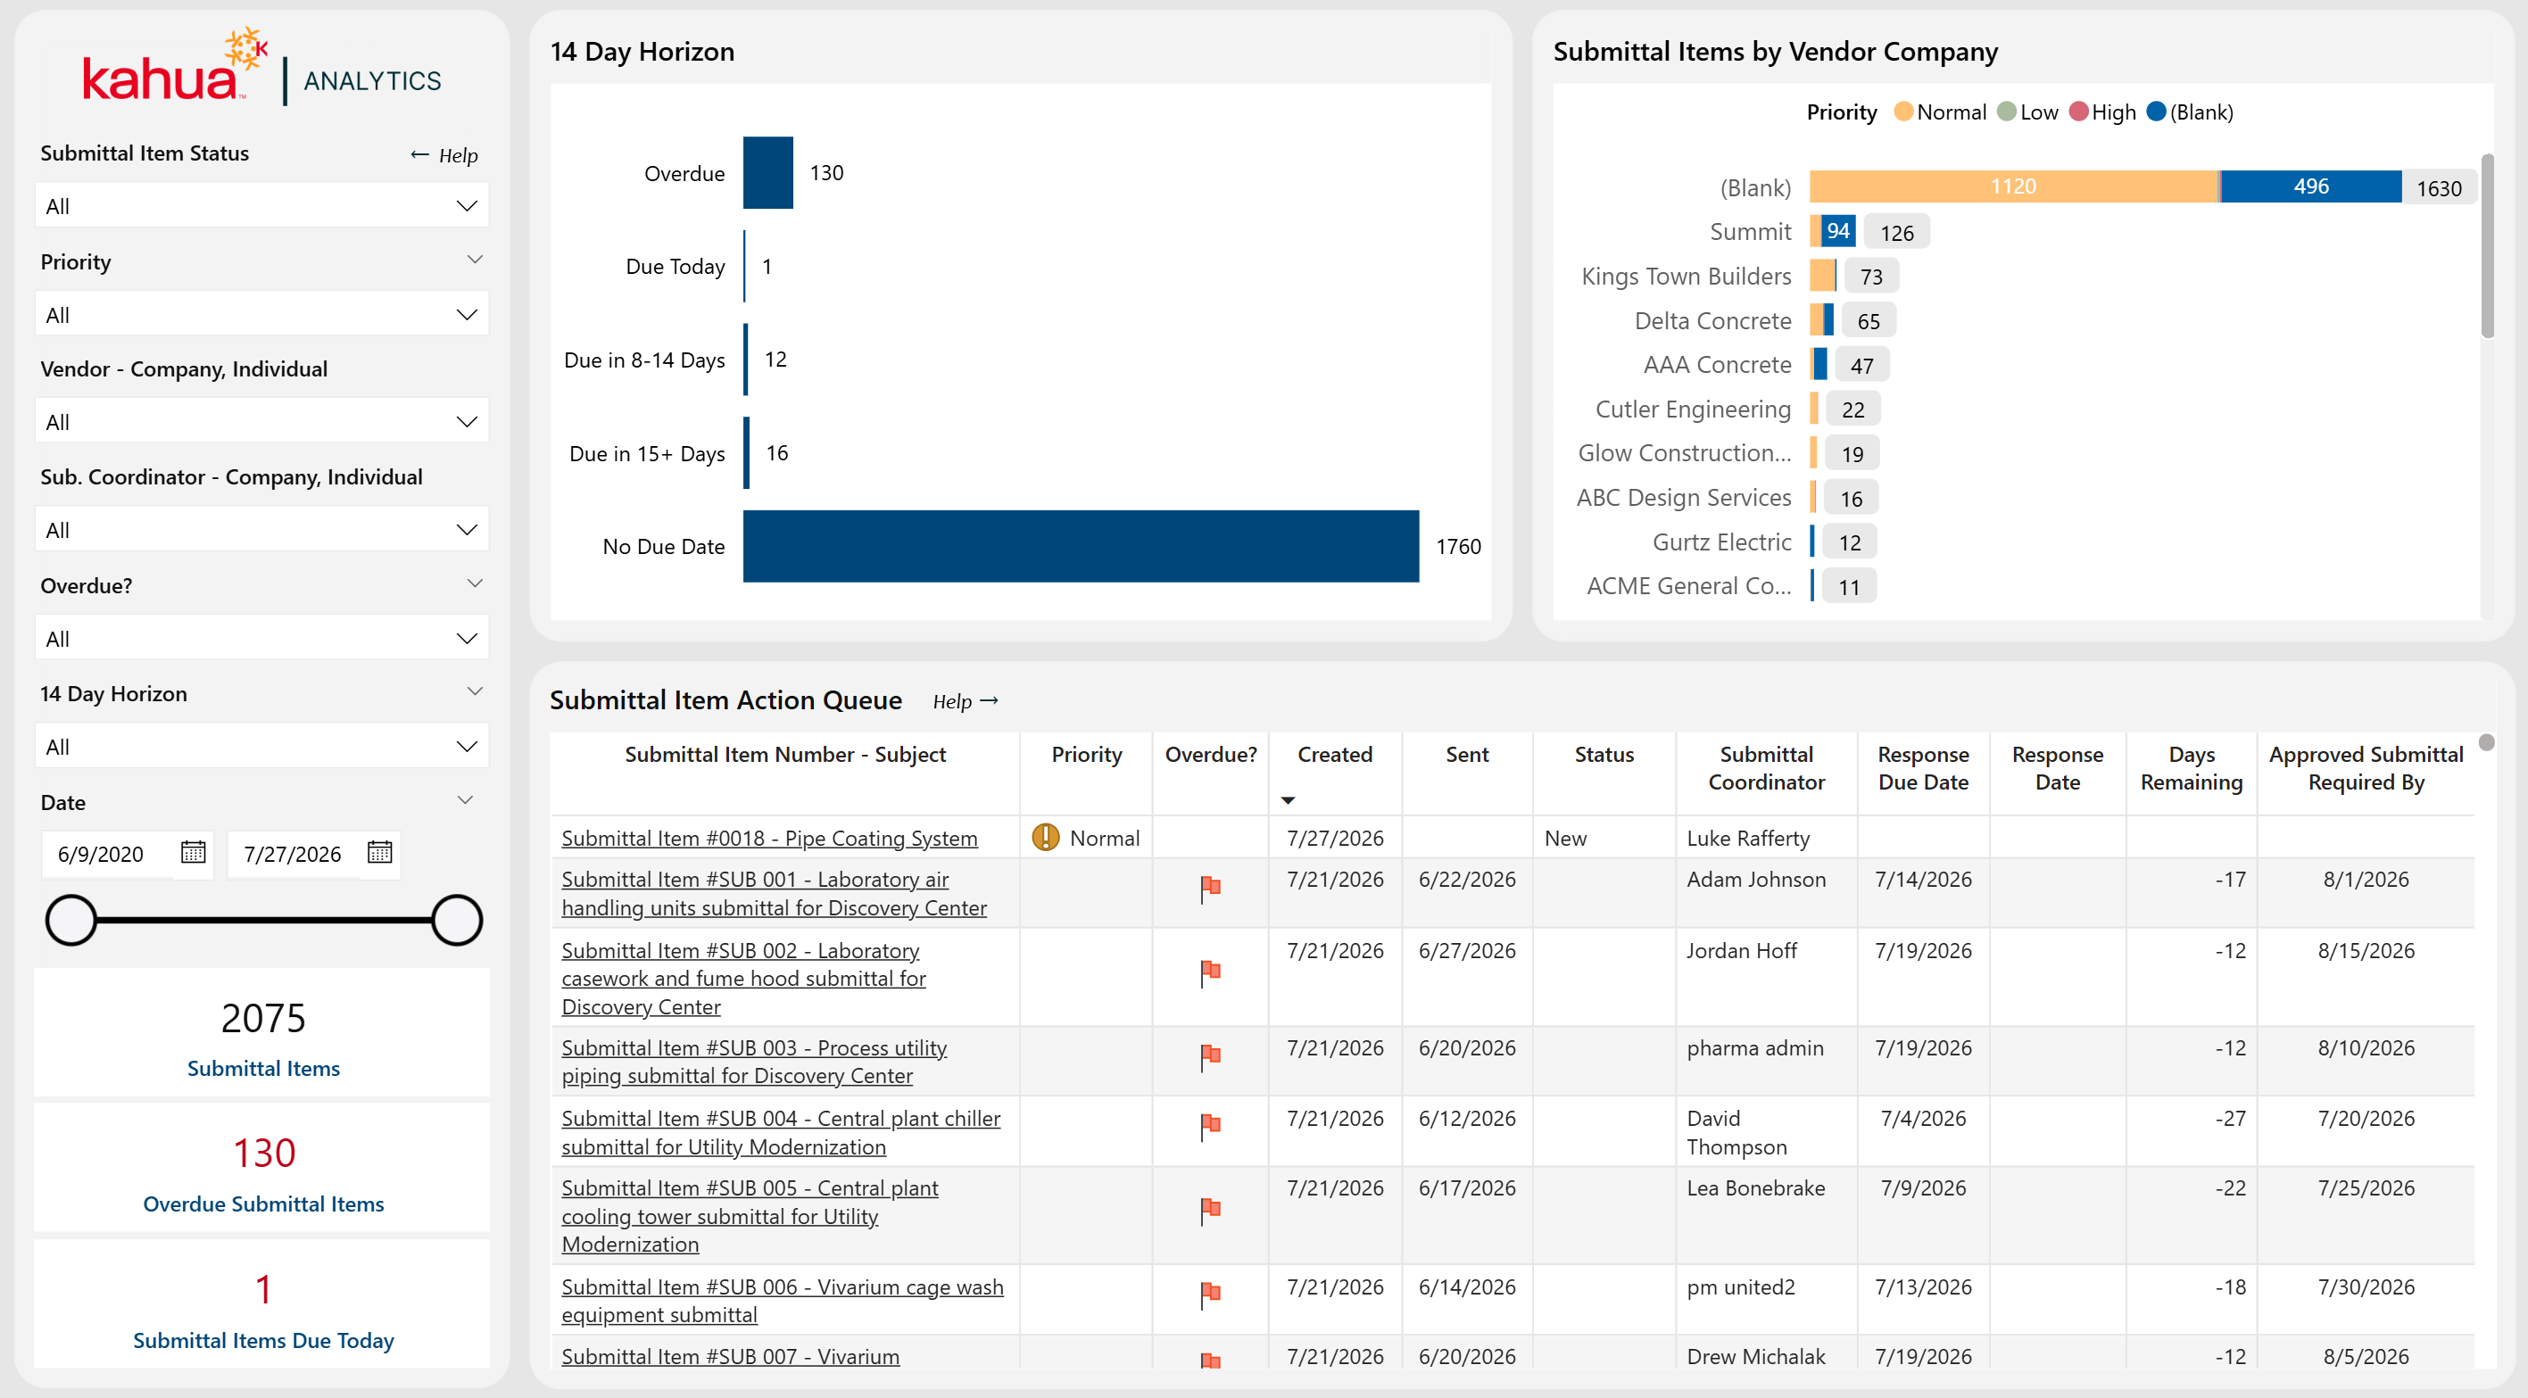
The Submittals dashboard offers a centralized view of submittal item activity across the portfolio, including status, submitting vendors, coordinators, due dates, and overdue items.
Description
Tracks open submittals by vendor and due date, helping users monitor review timeliness and vendor performance.
Problem
Coordinating the submittal process between multiple vendors, reviewers, and project teams can be challenging. Without a centralized view, overdue submittals and stalled reviews can go unnoticed, creating downstream schedule impacts.
Benefit
By centralizing submittal data with deadline tracking and vendor-level breakdowns, users can streamline the review process, hold vendors and coordinators accountable, and reduce submittal-related delays across the portfolio.
Required Kahua Applications
To utilize this dashboard, users must have Submittal Items enabled.
-
Portfolio Manager
-
Submittals (Submittal Items)
Out of the Box Dashboard Interface
Issues
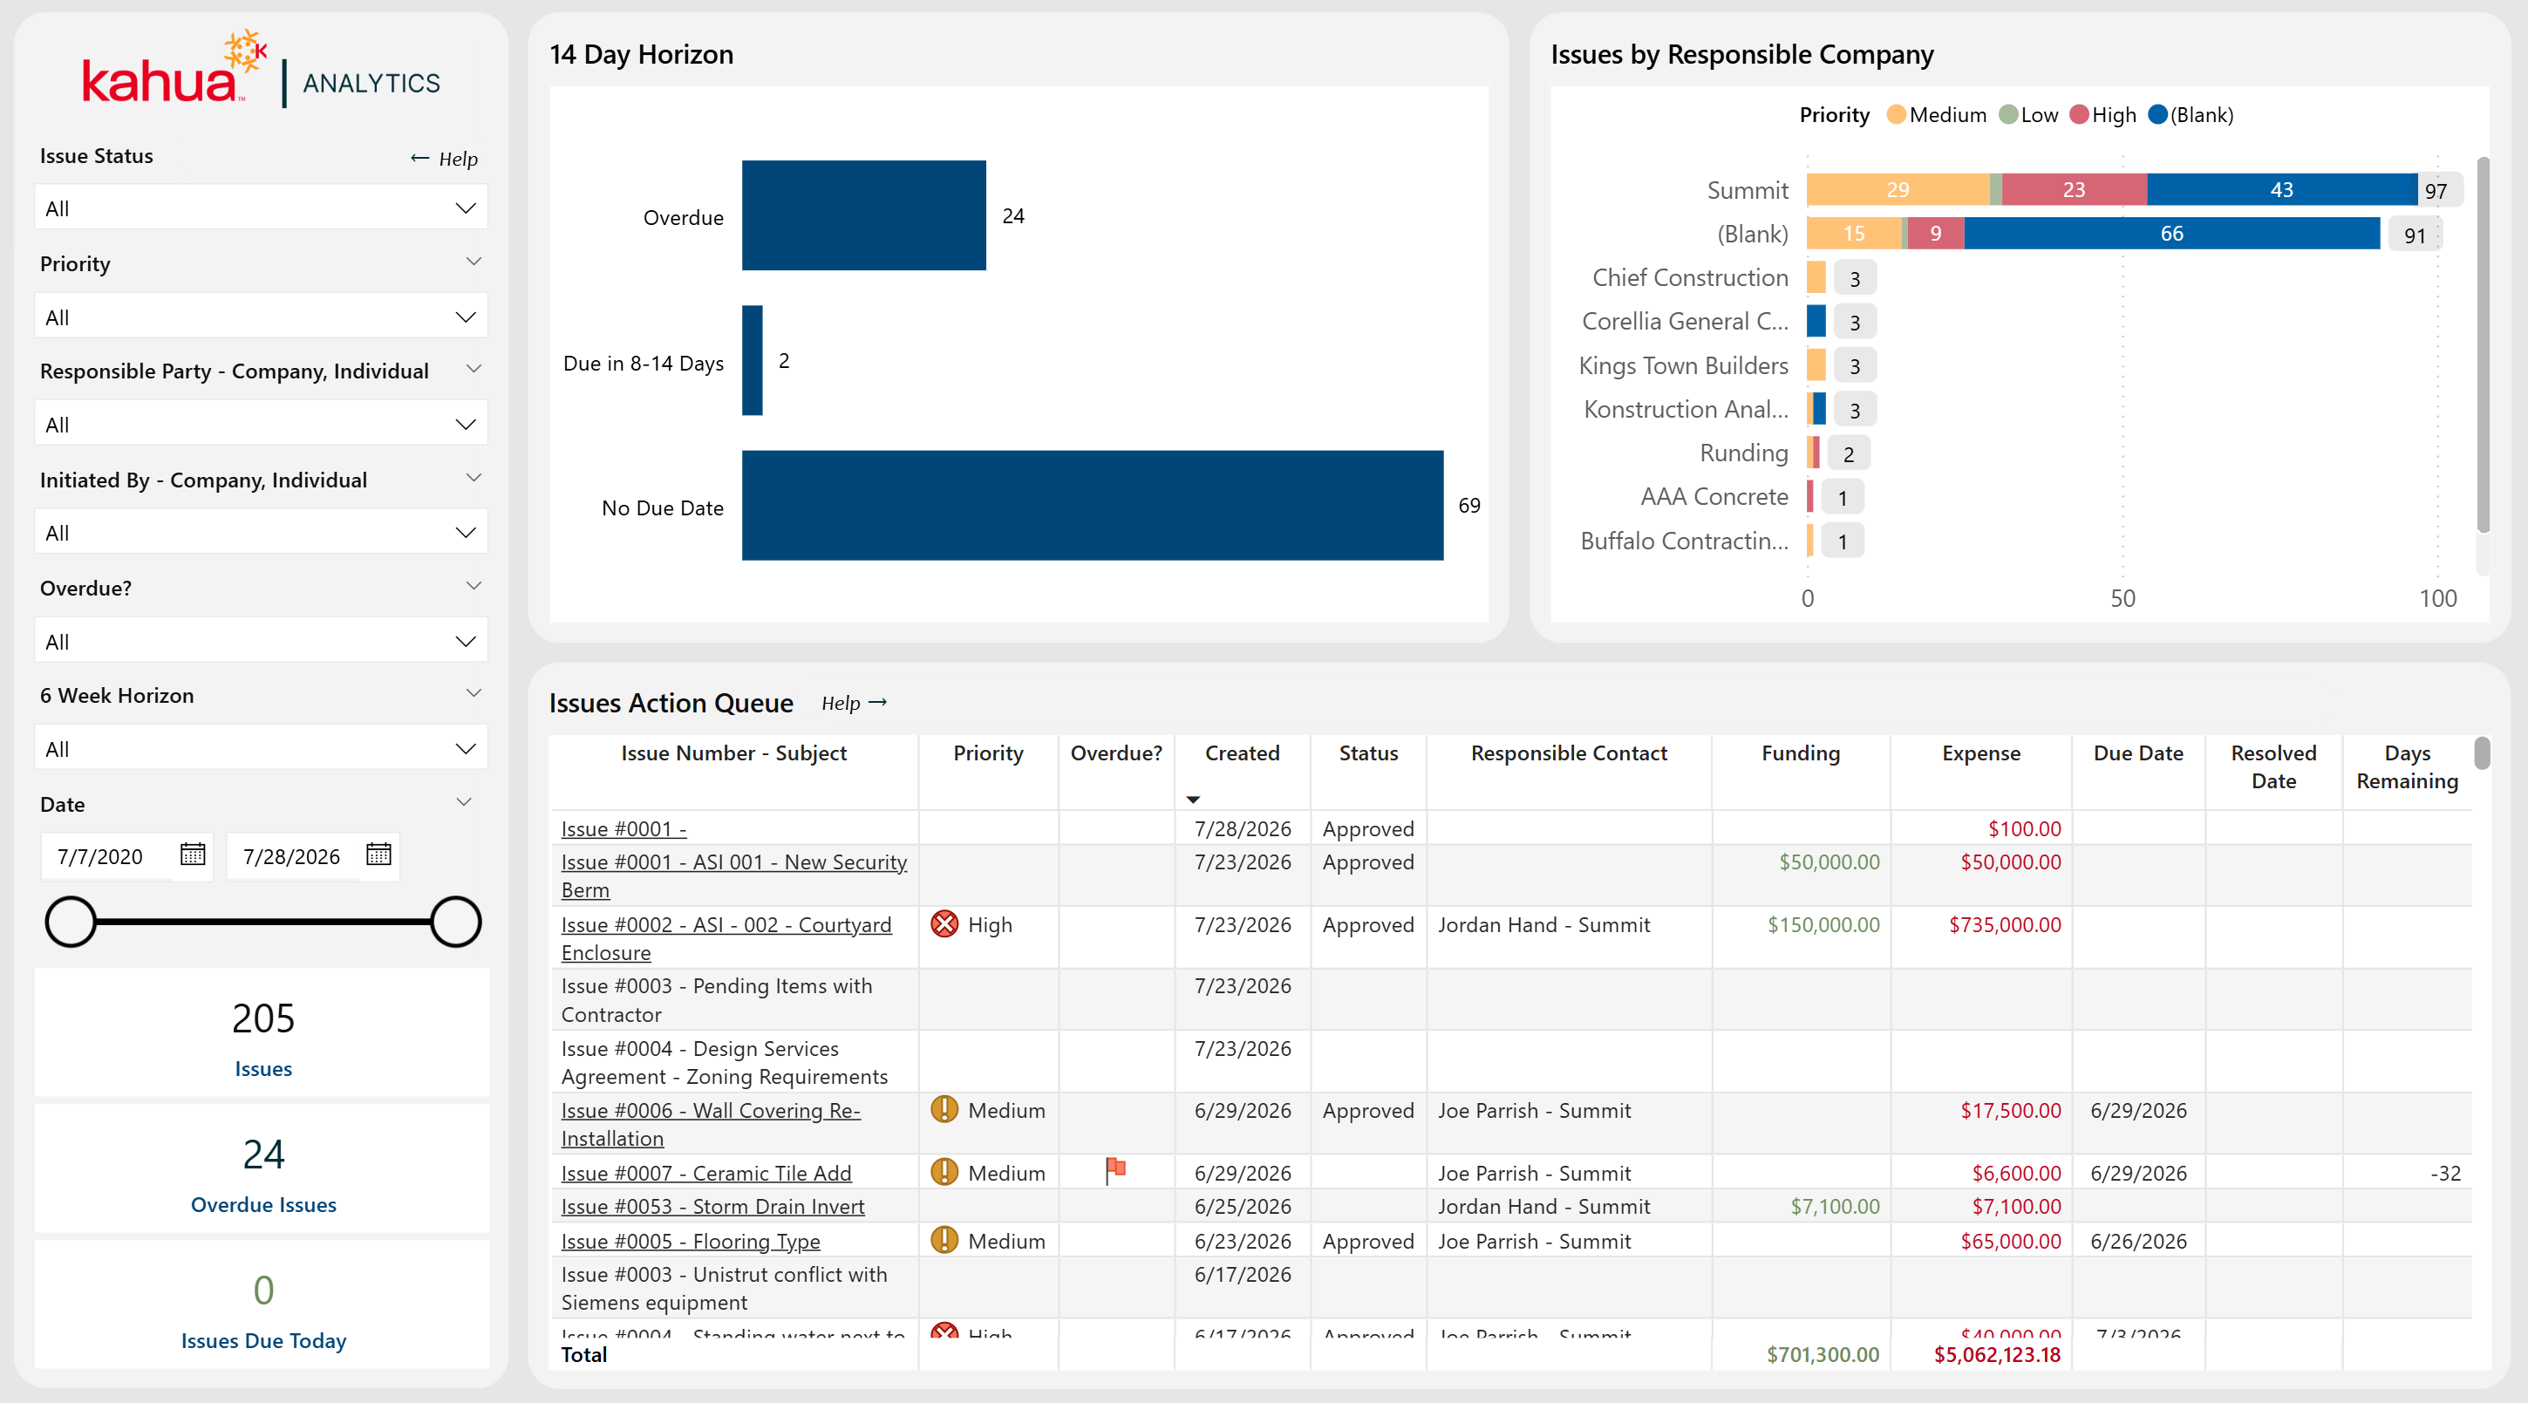
The Issues dashboard delivers a centralized view of project issues, their status, responsible parties, and financial impact across the portfolio.
Description
Tracks open issues by responsible company and due date, helping users monitor resolution progress and cost exposure.
Problem
Tracking and prioritizing issues, identifying responsible parties, and assessing financial impacts across multiple projects can be difficult. Without centralized visibility, unresolved issues can escalate into larger cost and schedule problems.
Benefit
By centralizing issue data with financial tracking, users can identify critical issues and mitigate cost overruns.
Required Kahua Applications
-
Issues
-
Portfolio Manager
Out of the Box Dashboard Interface
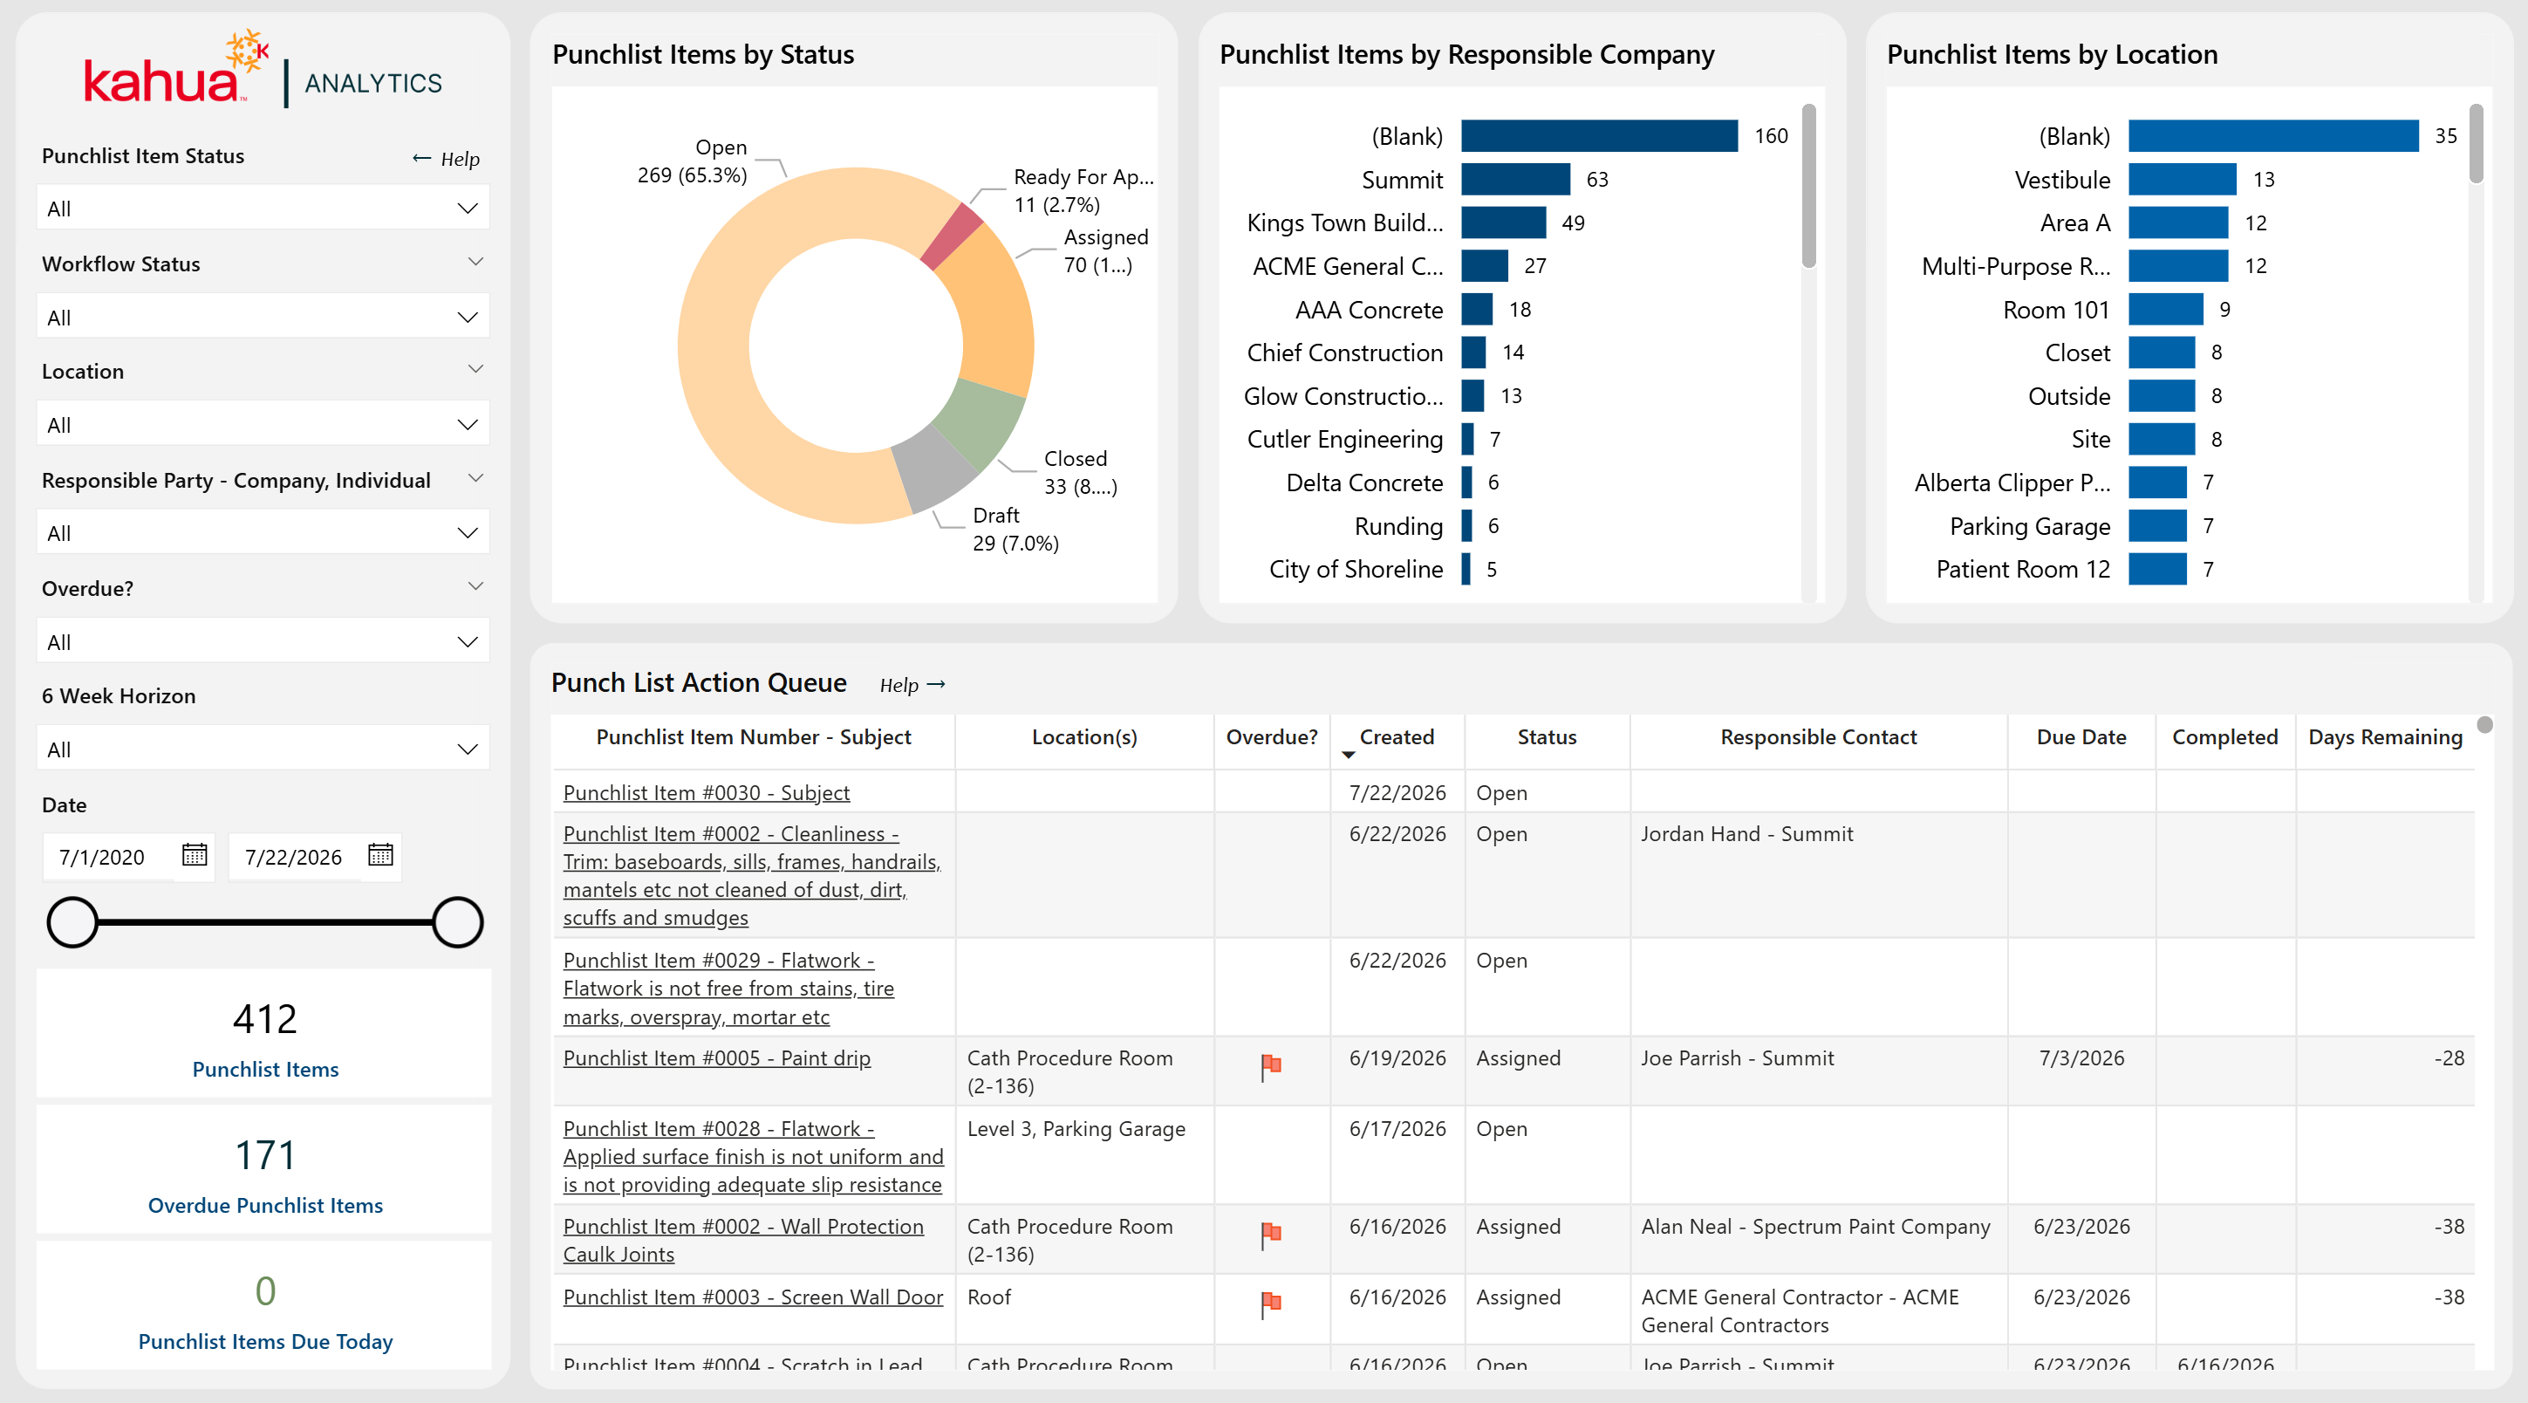
Punch Lists
The Punch Lists dashboard provides a centralized view of punch list activity across the portfolio, including item status, responsible companies, locations, and due dates.
Description
Tracks open punch list items by status, location, and responsible trade to monitor closeout progress.
Problem
Managing large volumes of punch list items across multiple projects and locations during closeout can be overwhelming. Without visibility into which items are overdue and which trades are responsible, final completion timelines can extend significantly.
Benefit
By centralizing punch list data with status and location breakdowns, users can prioritize urgent items and drive efficient closeout.
Required Kahua Applications
-
Portfolio Manager
-
Punch Lists
Out of the Box Dashboard Interface
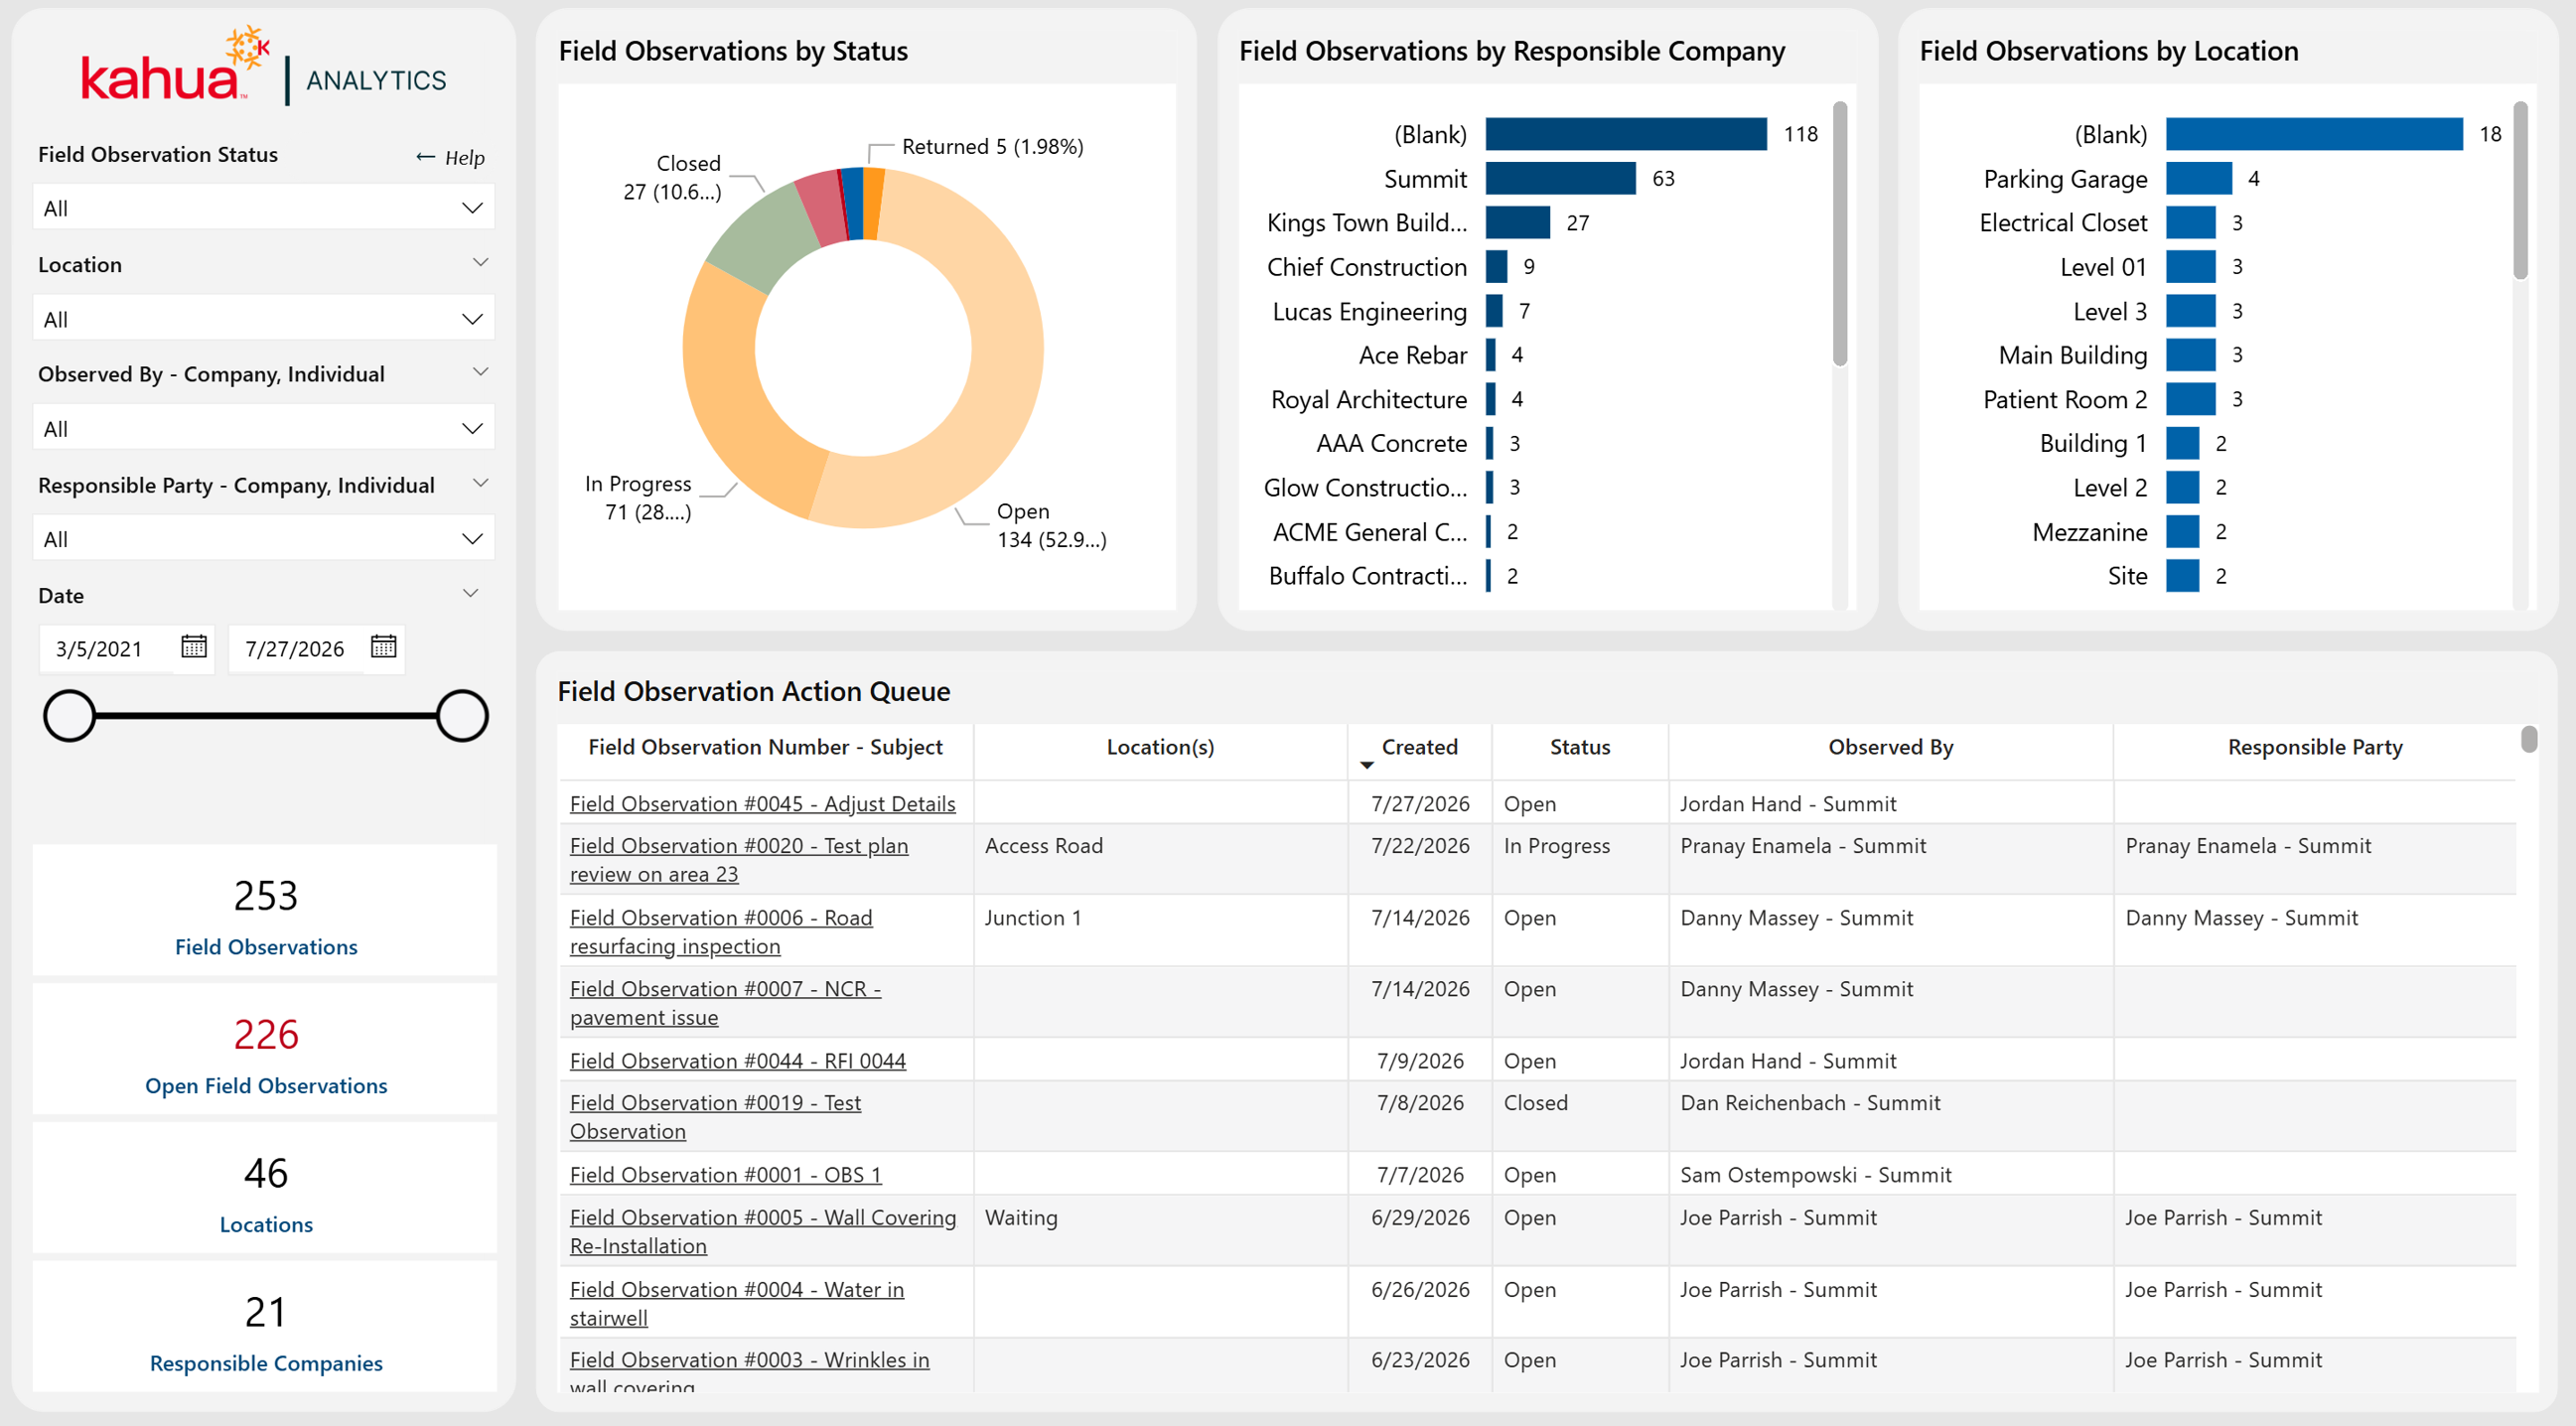
Field Observations
The Field Observations dashboard presents a centralized view of on-site observations, including observer, location, responsible party, and status across the portfolio.
Description
Tracks open observations by status, location, and responsible company to identify areas requiring attention.
Problem
On-site concerns can remain unresolved without clear oversight into all open field observations. Without centralized visibility, scattered records make it difficult to identify patterns across locations and responsible parties, jeopardizing project timelines, quality, and safety.
Benefit
By centralizing field observation data, users can enhance accountability and ensure timely resolution of on-site issues.
Required Kahua Applications
-
Field Observations
-
Portfolio Manager
Out of the Box Dashboard Interface
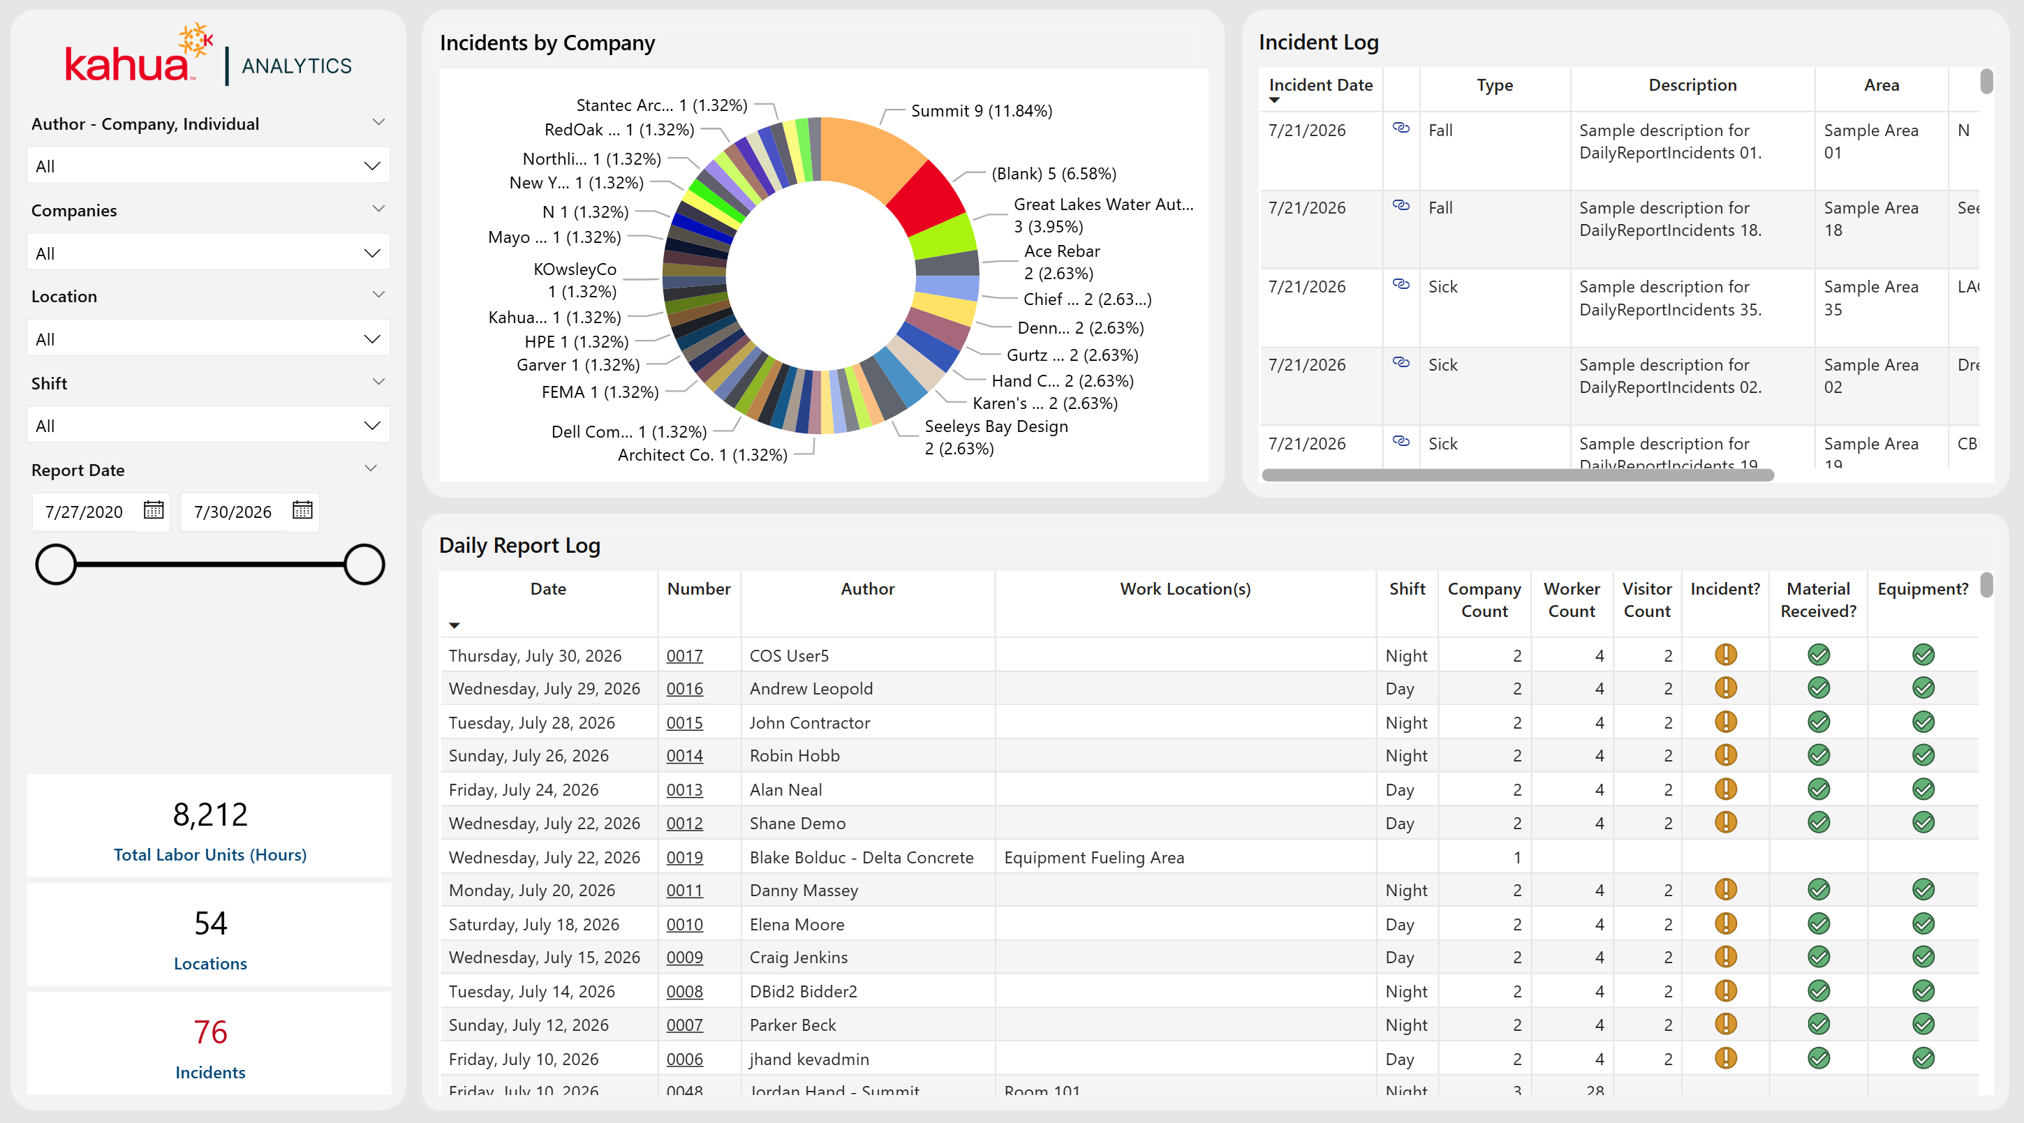
Daily Reports
The Daily Reports dashboard offers a centralized view of information captured through daily reporting, including labor activity, equipment usage, weather conditions, production progress, incidents, and company involvement across the portfolio.
Description
Summarizes daily reporting activity, incident tracking, and company-level breakdowns for the project.
Problem
Reviewing individual daily reports across multiple projects and dates can be time-consuming. Without a consolidated view, incident trends, labor patterns, and operational issues may go unnoticed.
Benefit
By centralizing daily report data, users can monitor field activity, identify safety trends, and maintain visibility into day-to-day operations.
Required Kahua Applications
-
Daily Reports
-
Portfolio Manager
Out of the Box Dashboard Interface
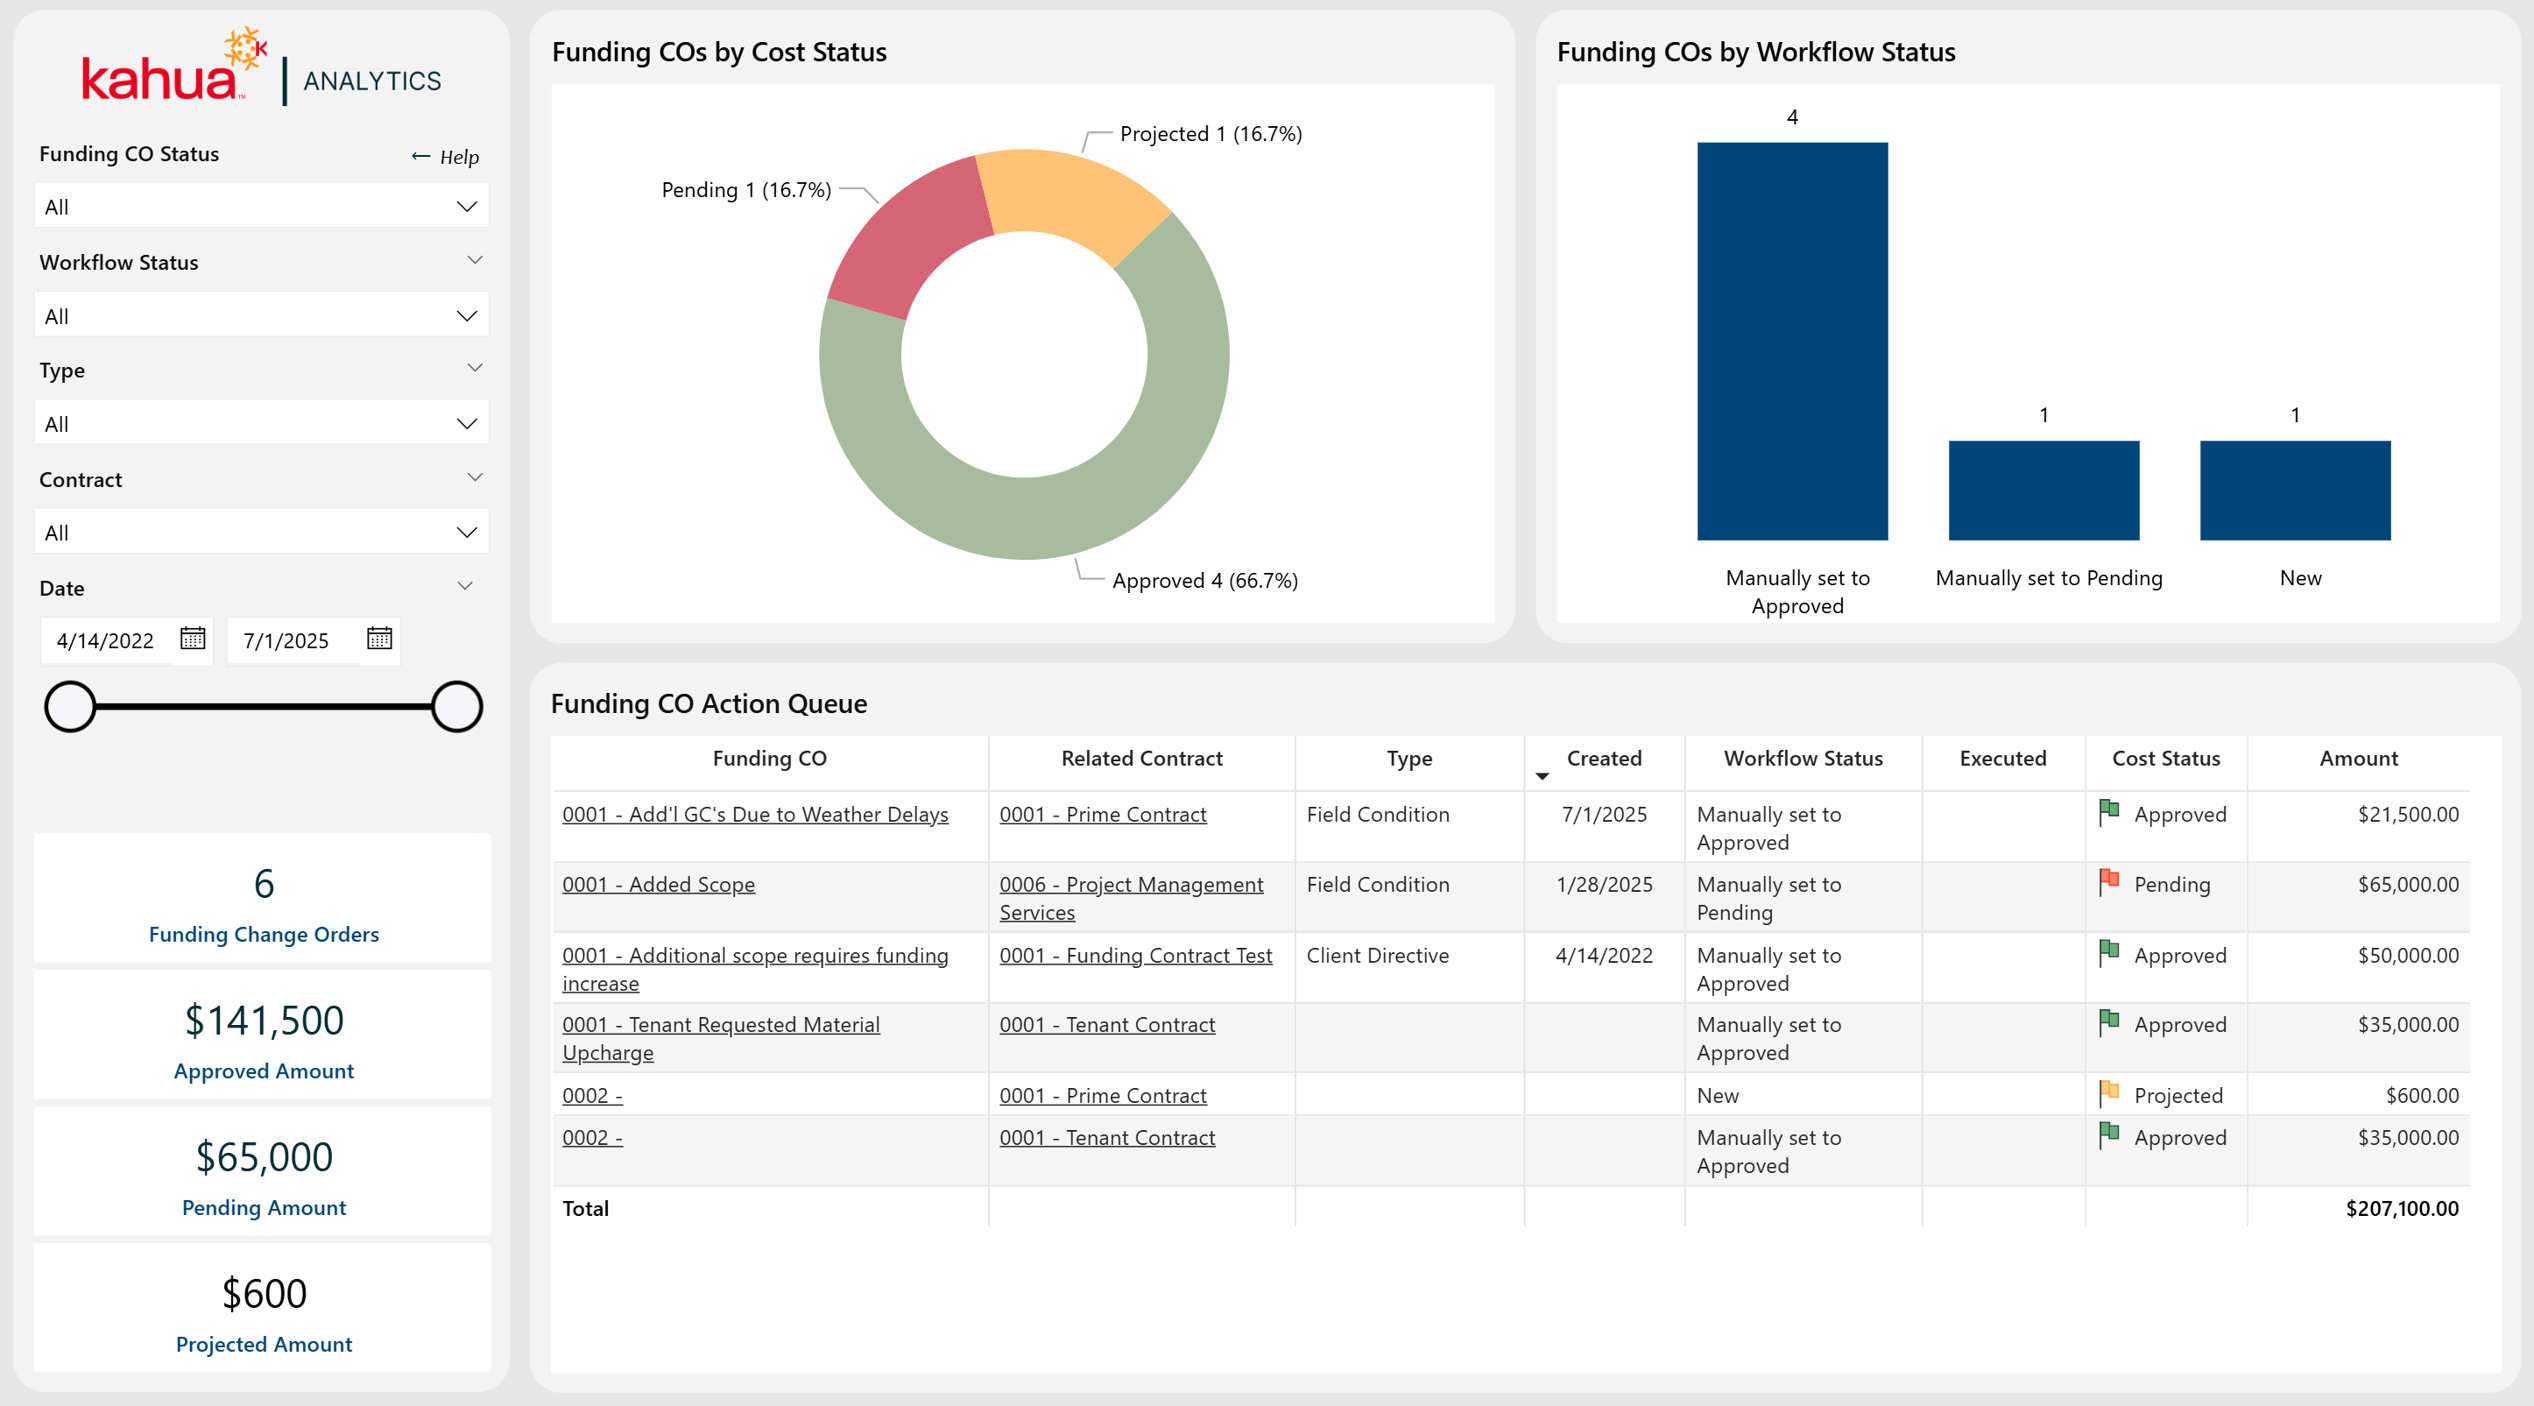
Funding Change Orders
The Funding Change Orders dashboard provides a centralized view of owner and client-side funding change order activity across the portfolio, including status, workflow progress, cost status, and associated contract details.
Description
Tracks funding change orders by workflow status and approval progress, with key metrics for approved and pending amounts.
Problem
Funding change orders from owners and clients can have significant financial implications. Without centralized tracking of their status and approval timelines across multiple projects and contracts, pending approvals can create budget uncertainty.
Benefit
By tracking funding change orders with workflow and cost status breakdowns, users can monitor approval progress and assess financial exposure.
Required Kahua Applications
-
Funding Change Orders
-
Portfolio Manager
Out of the Box Dashboard Interface
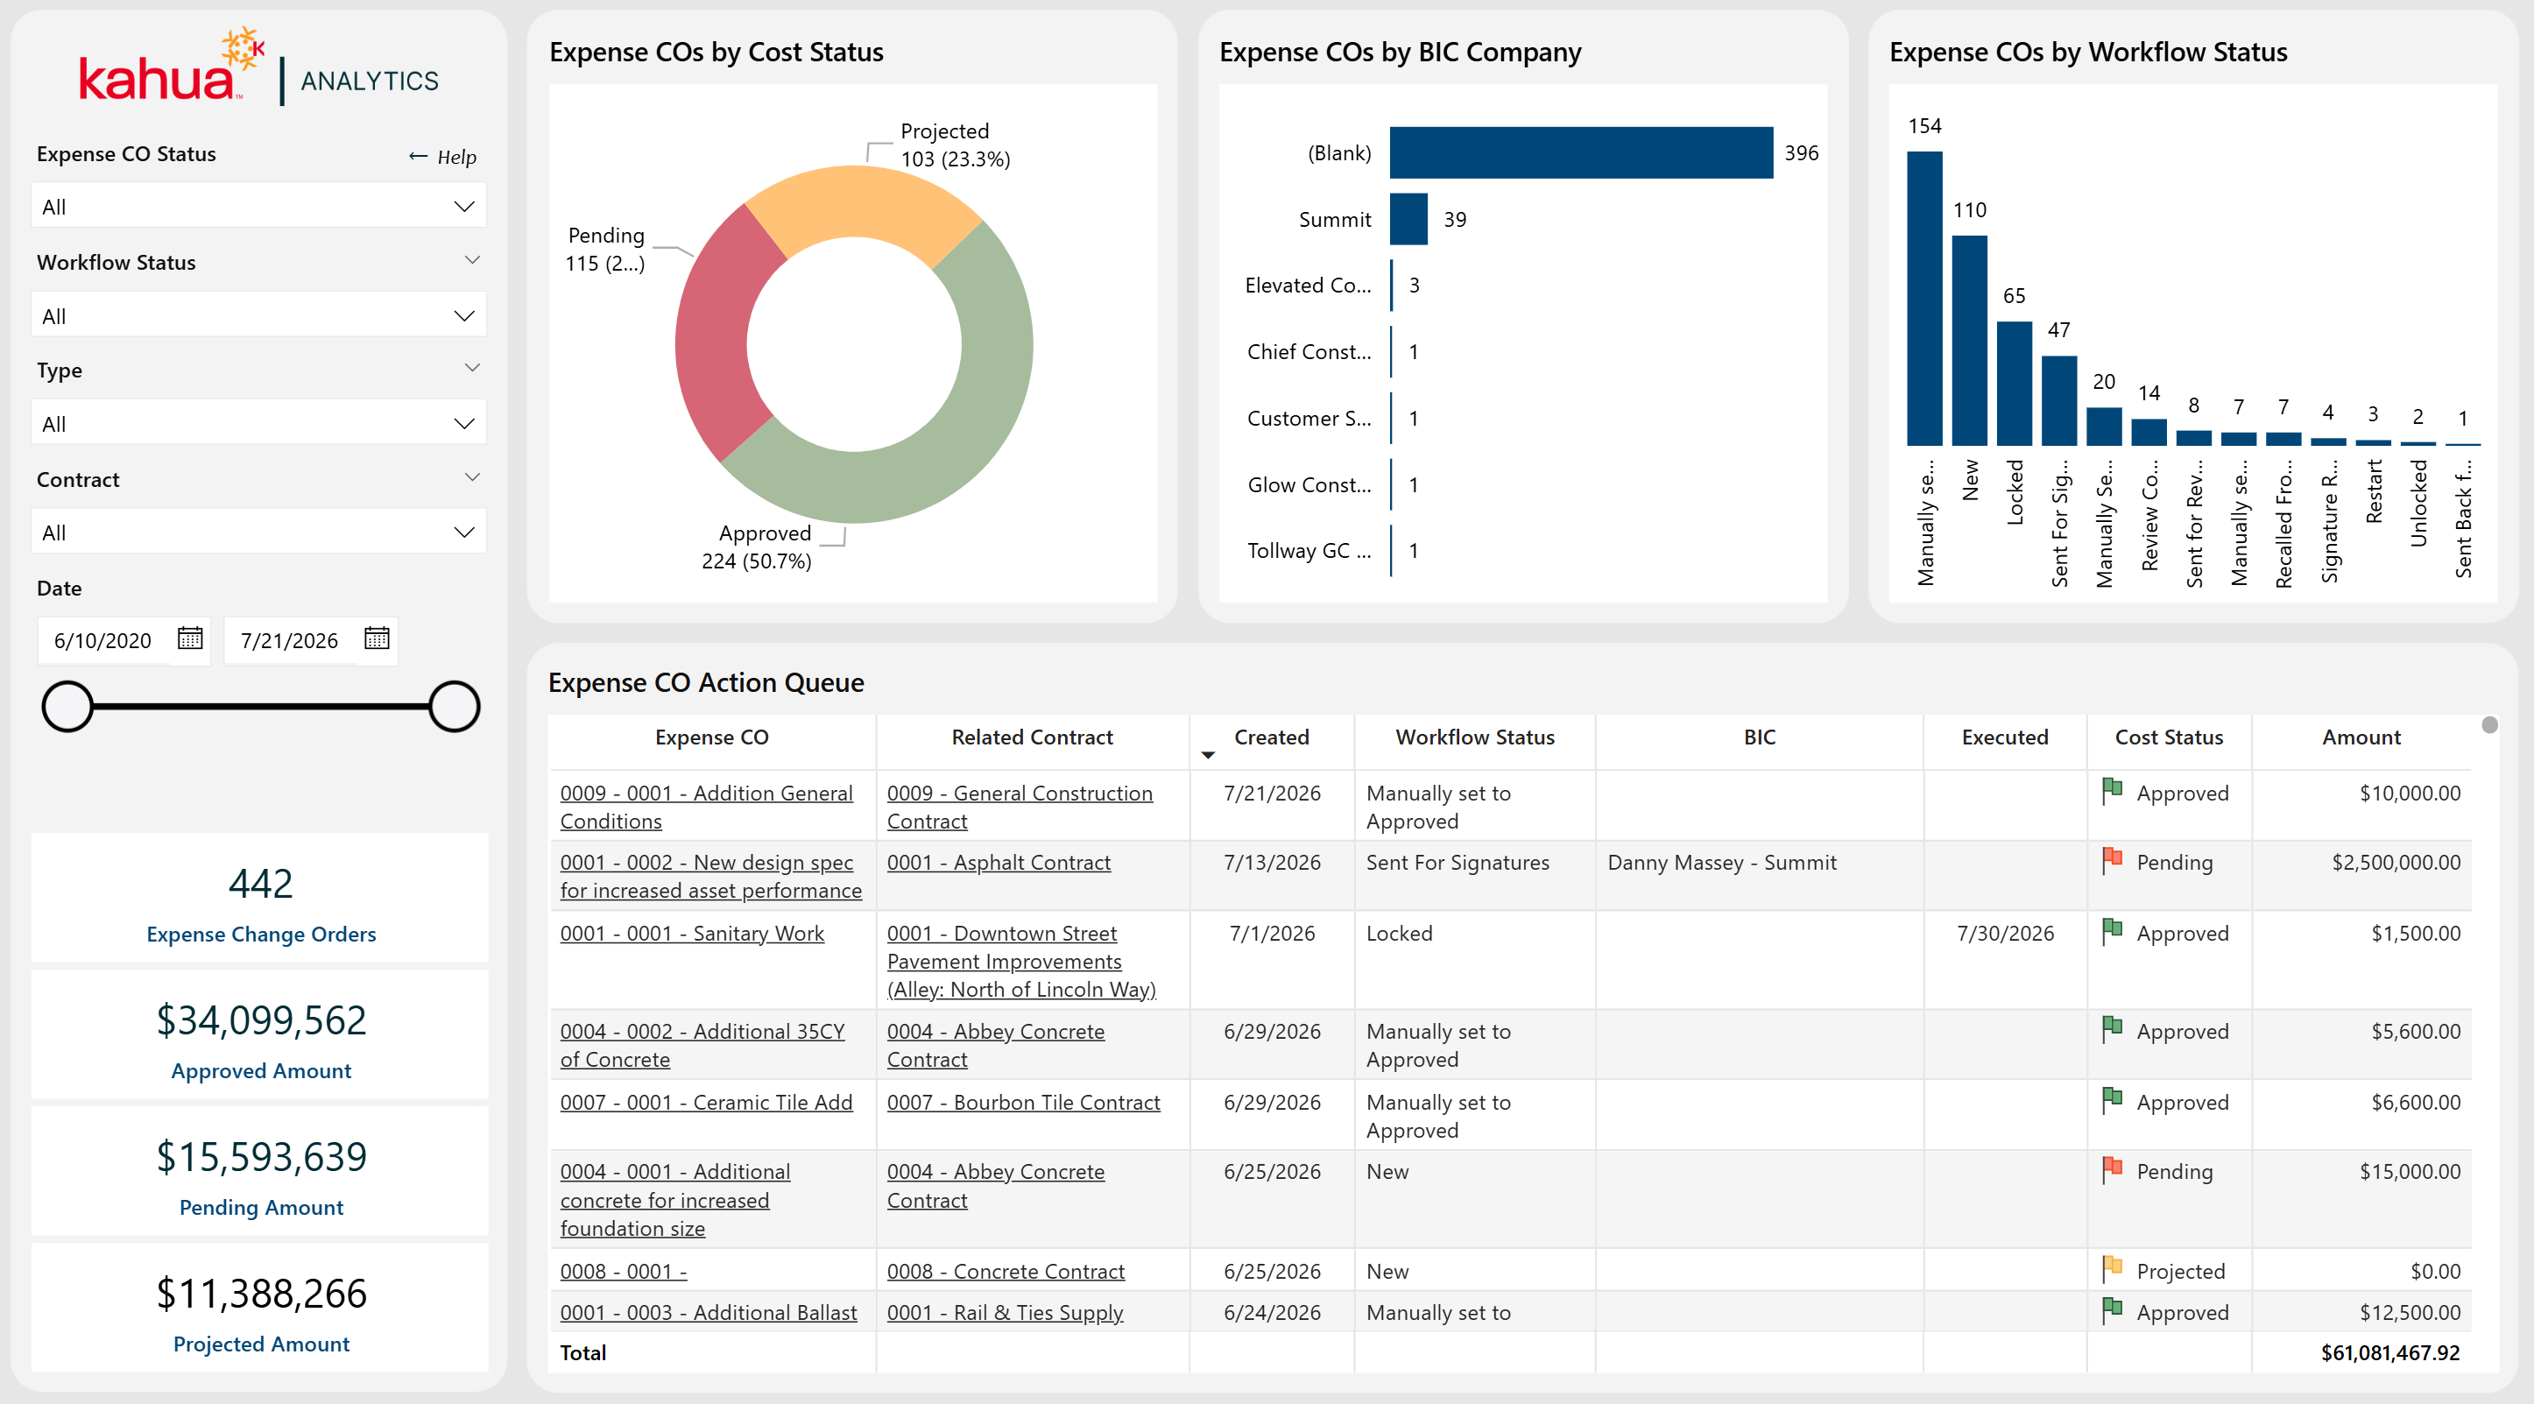
Expense Change Orders
The Expense Change Orders dashboard delivers a centralized view of contractor-side expense change order activity across the portfolio, including status, workflow progress, cost status, ball-in-court assignments, and associated contract details.
Description
Tracks expense change orders by workflow status, cost status, and ball-in-court responsibility, with key metrics for approved and pending amounts.
Problem
Expense change orders require timely review and approval to maintain accurate cost tracking. Without centralized visibility across multiple projects and responsible parties, delays in the approval process can lead to inaccurate budget forecasts and stalled project progress.
Benefit
By tracking expense change orders with workflow and ball-in-court breakdowns, users can monitor approval progress and identify bottlenecks.
Required Kahua Applications
-
Expense Change Orders
-
Portfolio Manager
Out of the Box Dashboard Interface
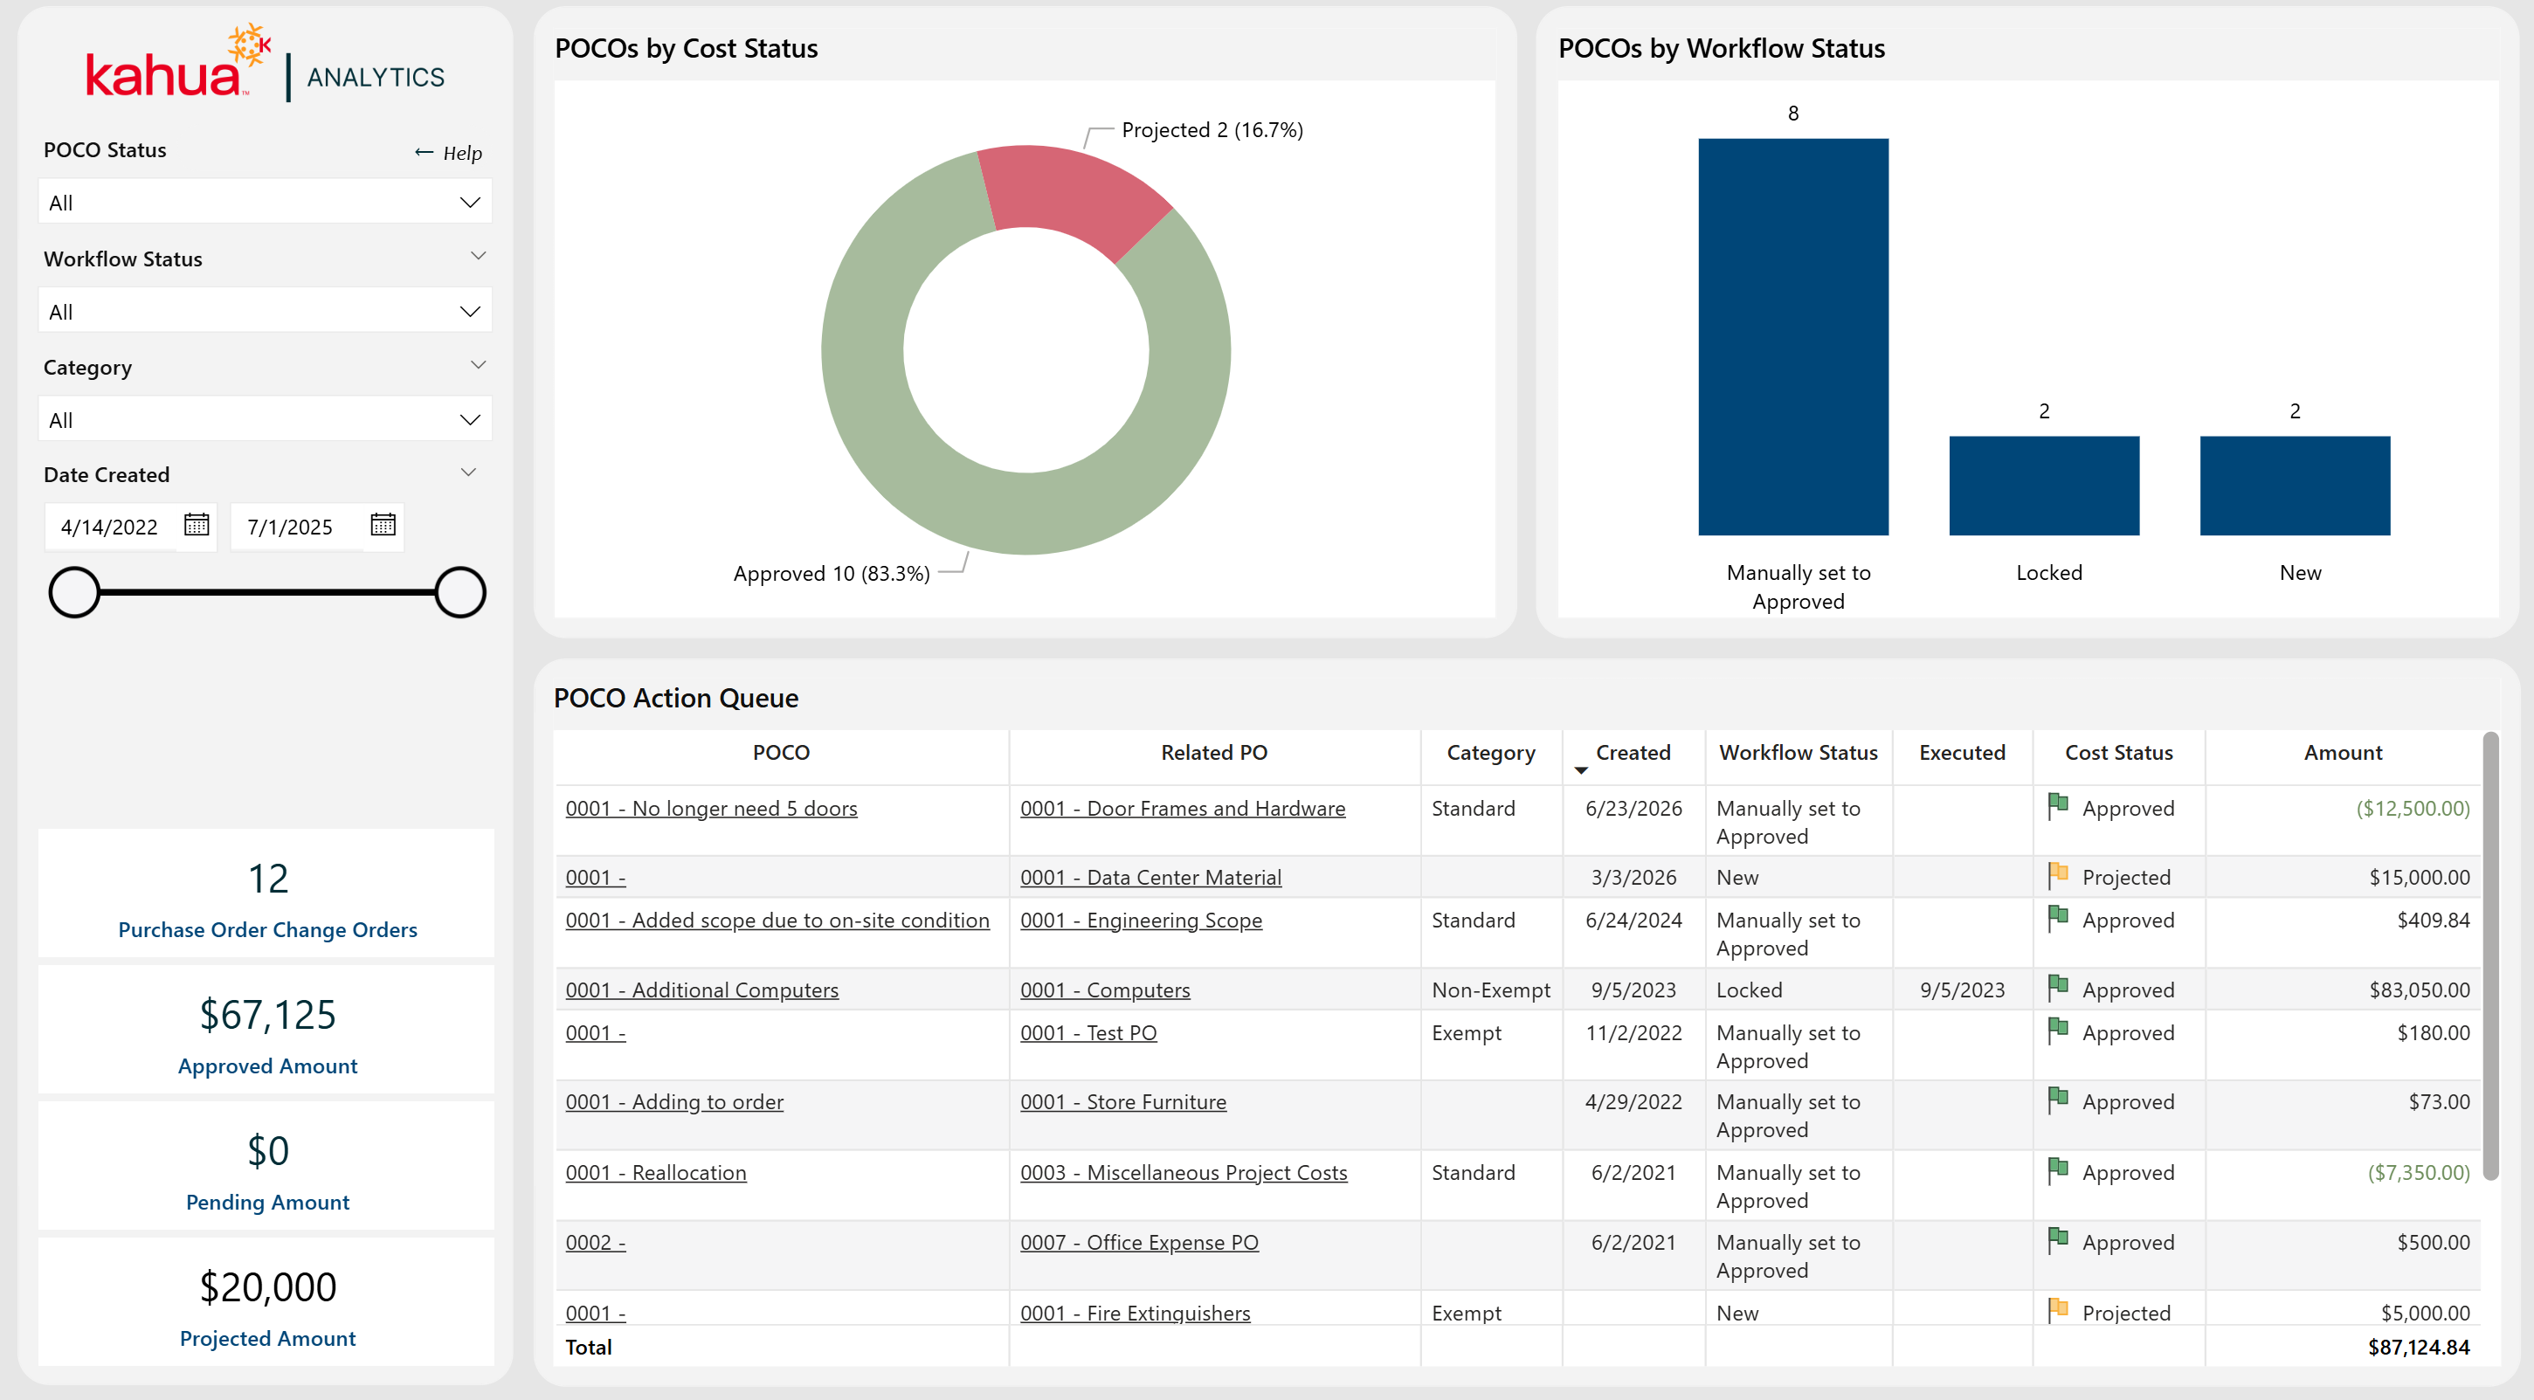
Purchase Order Change Orders
The Purchase Order Change Orders dashboard presents a centralized view of procurement-related change order activity across the portfolio, including status, workflow progress, cost status, and category details.
Description
Tracks purchase order change orders by workflow status and approval progress, with key metrics for approved and pending amounts.
Problem
Purchase order change orders can affect material costs, delivery schedules, and vendor commitments. Without centralized tracking of their status and approval progress, budget surprises and procurement delays can result.
Benefit
By tracking purchase order change order data with workflow and cost status breakdowns, users can monitor approval progress, assess financial exposure, and ensure timely processing of procurement and vendor commitment changes across the portfolio.
Required Kahua Applications
-
Portfolio Manager
-
Purchase Order Change Orders
Out of the Box Dashboard Interface