Kahua Analytics K-12 Package
Applicable Packages This article applies to the Kahua for K-12 Education package. If you are not sure if this is relevant to you, please contact your domain administrator.
The Kahua Analytics for K-12 Package offers a suite of dashboards for viewing and analyzing project and program financials, health, workflow status, timelines, etc. With live project data formatted for easy review, districts can spend less time analyzing information and more time presenting it to stakeholders.
Detailed descriptions of each dashboard can be found below:
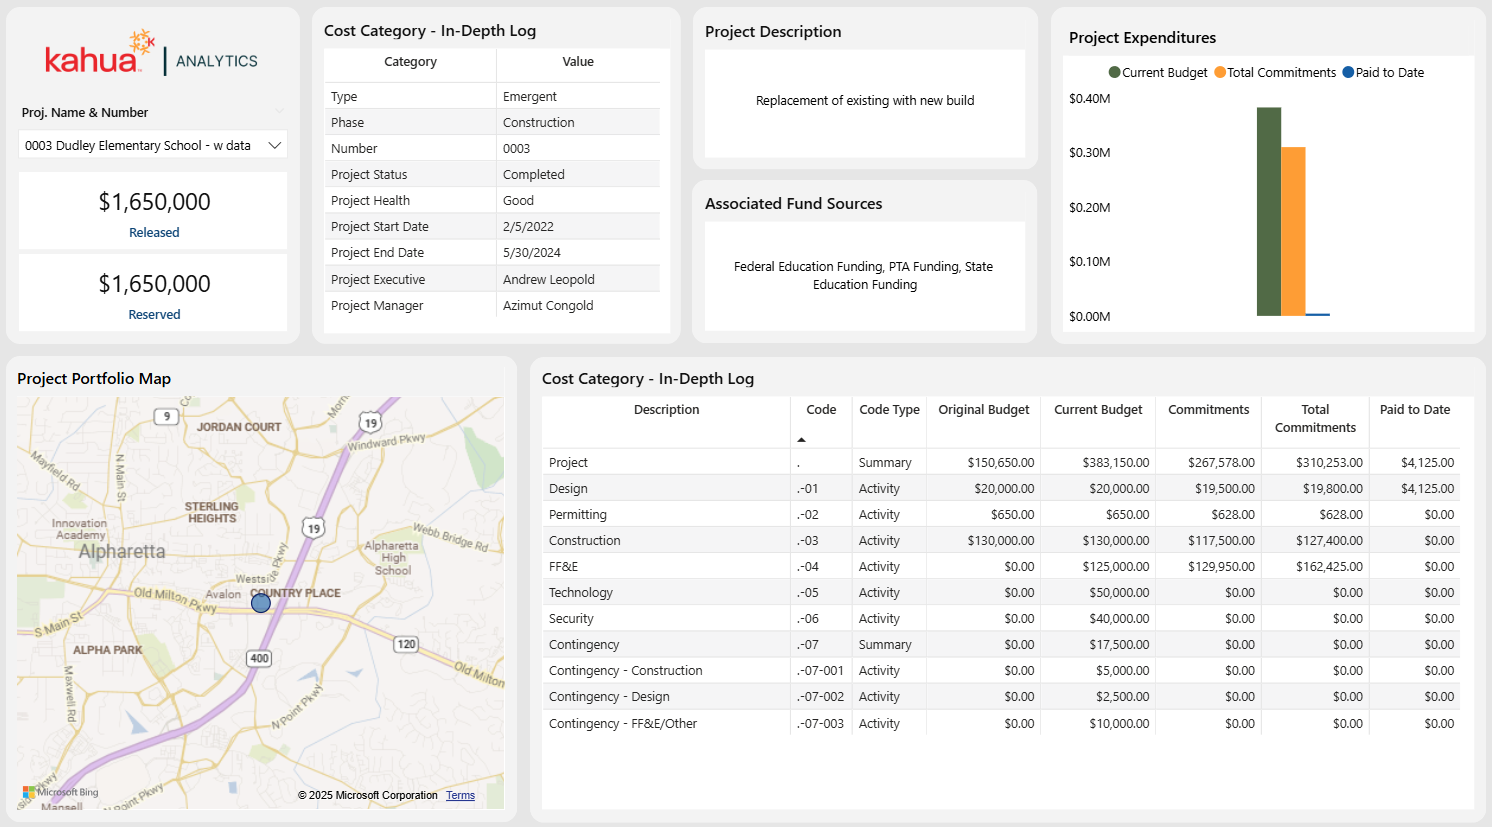
The Project Dashboard provides views into both individual projects and the entire portfolio. Users can survey key details such as project dates, status es, and health. Furthermore, they can review a detailed log of their total commitments, current budget, and amounts paid to date. More insights are available via the project description card, project location map, and project manager card.
Description
This dashboard compiles and displays key data from a project or portfolio. With the ability to view detailed and high-level cost information, as well as intricate details about project management and locations, users can keep up to date on all aspects of their project. This allows them to quickly pinpoint areas that require attention.
Problem
Project data is often plentiful and scattered. Thus, locating and reviewing it takes a large amount of time. Due to the daily pressures districts experience, they do not have the resources to spare for this task.
Benefit
With this dashboard, users can view and keep track of both project and portfolio data. The ability to have funding, cost, and general project information concentrated in one area alleviates the pressure of a detailed review. Any problems that may arise will be immediately visible, allowing them to be addressed swiftly.
The following apps are necessary to utilize this dashboard:
-
Portfolio Manager
-
Addresses
-
Work Breakdown
Out of the Box Dashboard Interface
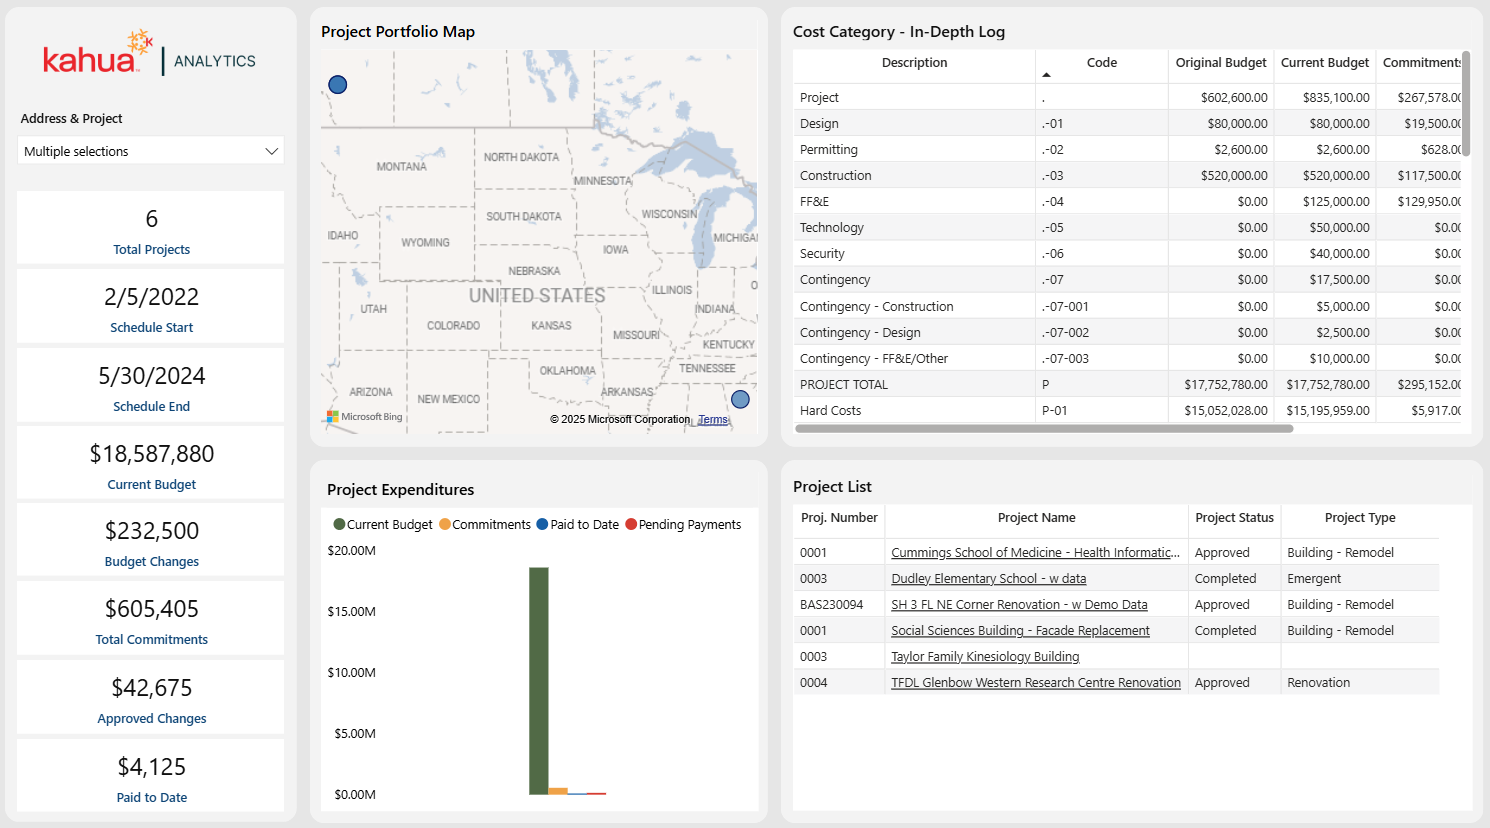
The Location Dashboard provides insight into nearby projects and their financial information. An interactive map showcases the areas where groups of projects are concentrated. Users can view the total number of projects in a selected area, as well as their name, number, status, and type. Cost information – such as current commitments and amount currently billed out – is displayed prominently on cards.
Description
This dashboard allows users to track projects by their location and view the financials associated with them. Through the detailed views of financial and general project information, users can understand what actions they need to take by location.
Problem
Keeping track of project financials within a location is imperative to ensure related costs do not exceed the budget. This is especially vital given the number of projects that can be associated with each school. However, determining these costs can be difficult given time constraints and extensive data.
Benefit
With this dashboard, users can easily keep track of the costs accumulating in certain locations. This allows for greater awareness and control of spending and allocation.
The following apps are necessary to utilize this dashboard:
-
Portfolio Manager
-
Addresses
-
Companies
-
-
People
-
Work Breakdown
Out of the Box Dashboard Interface
The Work Breakdown Structure (WBS) Dashboard provides an overview of a company’s data within the Work Breakdown app. It also incorporates information from the Sources of Funds app. A user can survey an overview of their WBS information and Sources of Funds data at the program level. Conversely, they can filter to a specific project and/or project number for a more project-level view.
Description
The WBS Dashboard summarizes each project’s financials according to the Work Breakdown Structure. Dynamic filtering allows users to monitor financial health at a project, funding source, or program level in one view.
Problem
Exporting and compiling all information within a program is a lengthy and difficult process. Often plagued by the inability to spare resources for this task, districts can struggle to gain the data they require.
Benefit
This real-time snapshot allows districts to accurately manage the amount of funds released, budgeted, committed, and paid for all projects within a program.
The following apps are necessary to utilize this dashboard:
-
Portfolio Manager
-
Sources of Funds
-
Work Breakdown
Out of the Box Dashboard Interface
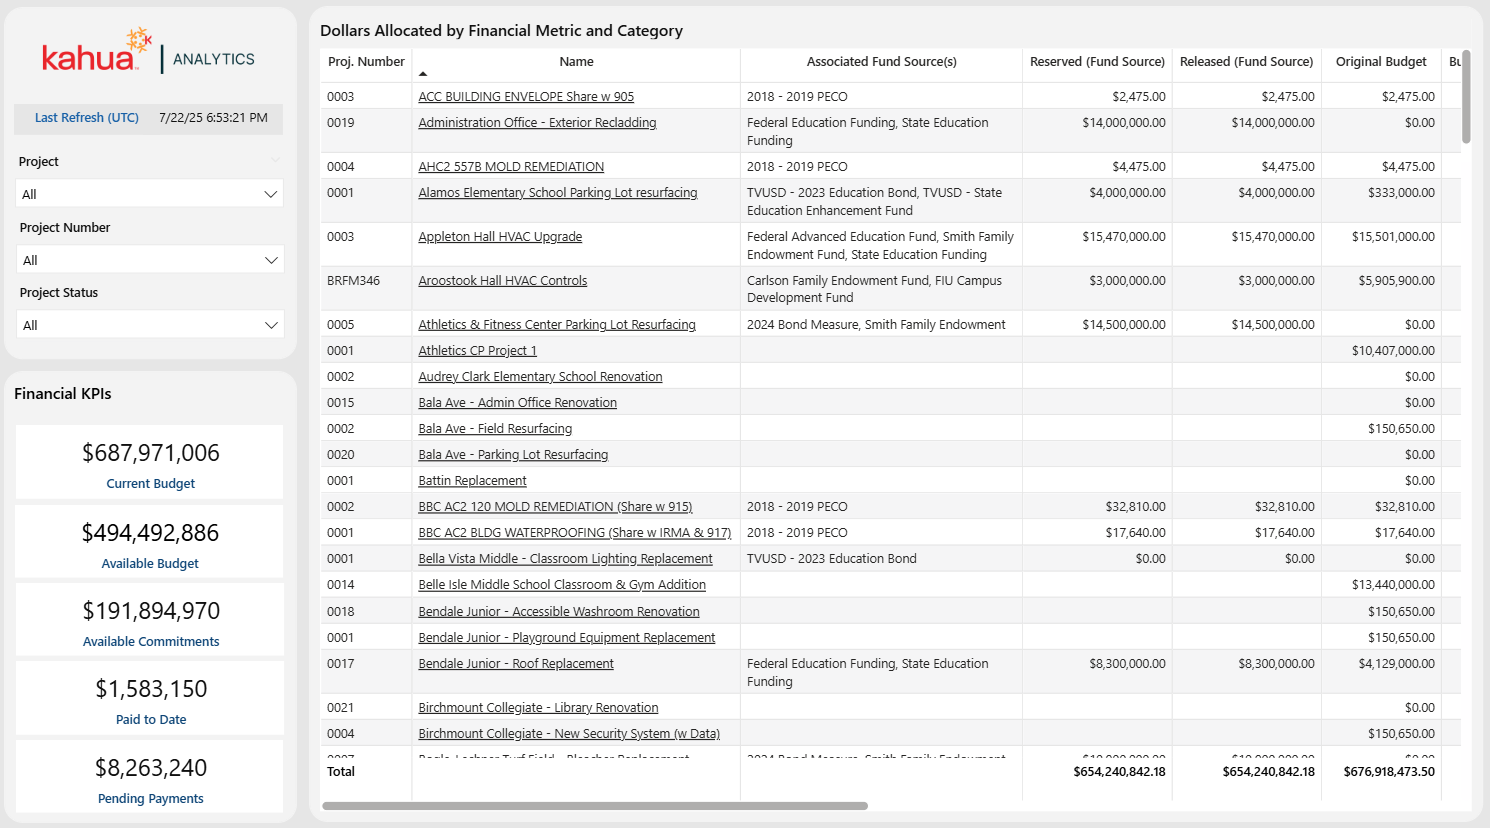
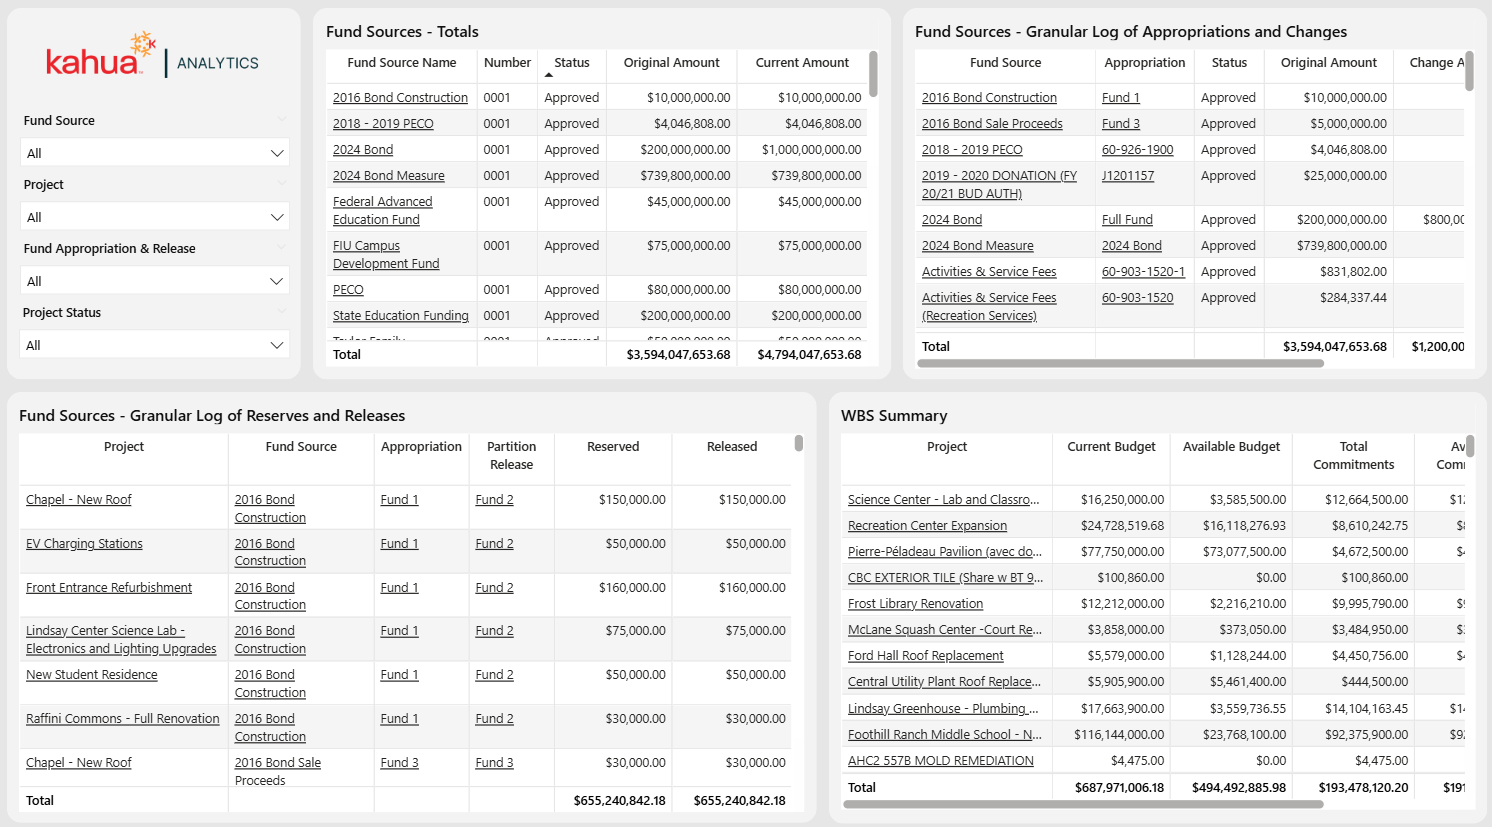
The Deep WBS Dashboard provides a more granular view of a company’s Sources of Funds app. In this dashboard, users can see Fund Source Totals and Appropriations, as well as Reserves and Releases. With the ability to filter by fund source, project, project status, and fund appropriation and release, users can gain a comprehensive overview of their funding sources. The WBS Summary table complements this data by displaying the overall budget, commitments, and payments. Furthermore, this dashboard can handle multi-funded projects, offering a dynamic view of sources of funds.
Description
This dashboard groups all projects within their respective funding sources, appropriations and releases. It also provides a financial summary of all budgets, commitments, and payments.
Problem
Without broad visibility into funding metrics, districts can struggle to manage portfolios of multi-funded projects. This can lead to a lack of awareness regarding the status of appropriations and whether overall funding is adequate to remain in budget.
Benefit
This dashboard provides visibility into funding capacities of all sources of funds based on the current project portfolio. With this extensive view, users can be aware of whether their funding is sufficient.
The following apps are necessary to utilize this dashboard:
-
Portfolio Manager
-
Sources of Funds
-
Work Breakdown
Out of the Box Dashboard Interface
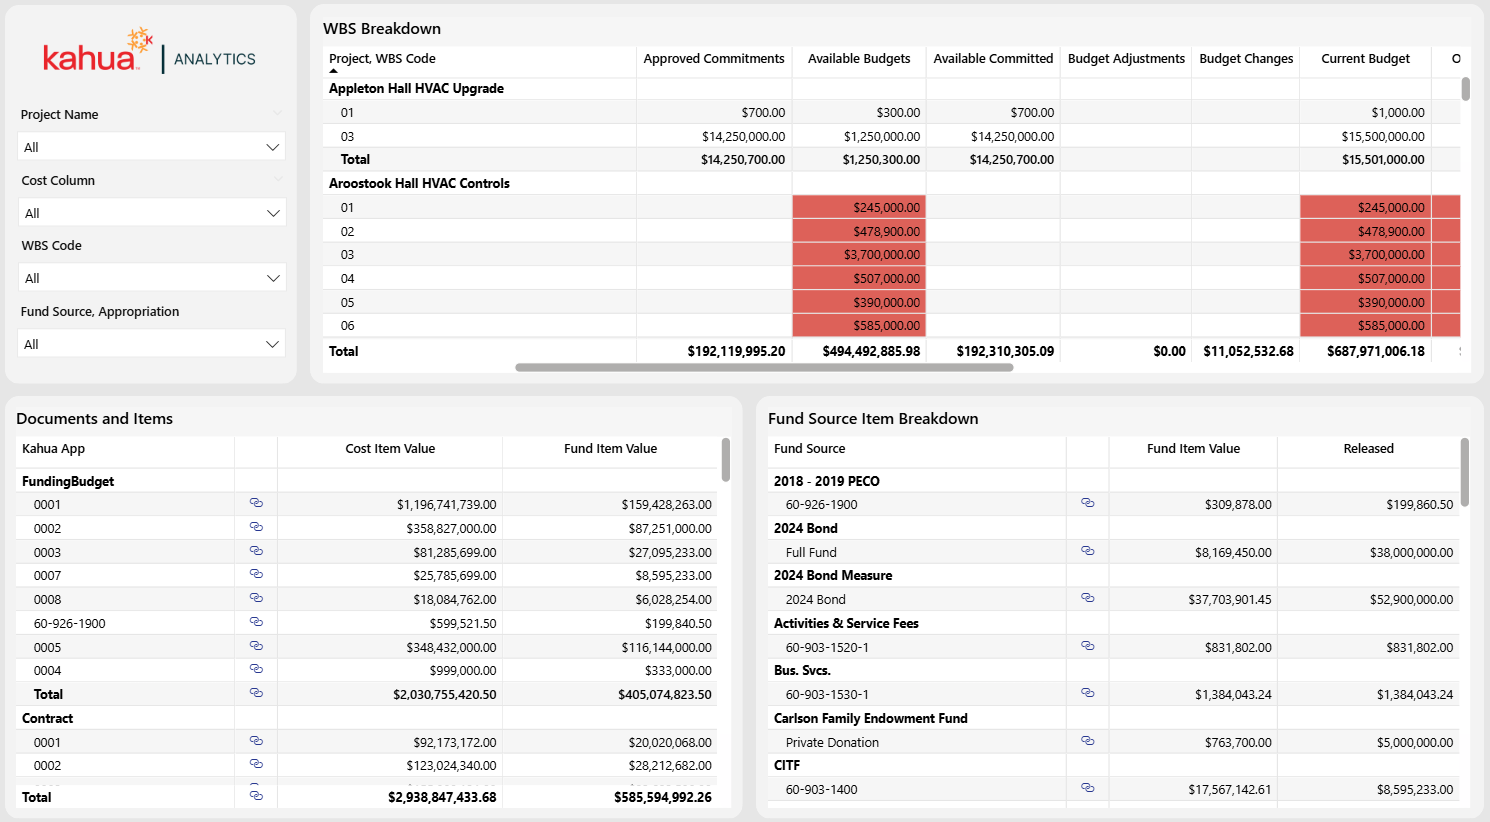
The Fund Item Reconciliation Dashboard displays a matrix view breakdown of cost items across an entire domain. These are divided by project, cost item type, and WBS Code. If a cost item does not have a fund source allocated to it, users can solve this problem through the provided links and totals of Cost Items vs. Fund Items. This allows for the reconciliation of unfunded cost items.
Users can also click into individual document types for each WBS code, displaying all cost items and fund items for that selection. This can help them identify the documents that make up a selection and ensure that it has funding.
Description
This dashboard displays the cost item data for the user's domain. Visual indicators showcase discrepancies between cost items and fund items.
Problem
With many cost items spread across multiple projects, cost item types, and WBS codes, it can be difficult to identify those which lack funding.
Benefit
With the quick-access links built into this dashboard, users can easily find which unfunded cost items and take measures to rectify this.
The following apps are necessary to utilize this dashboard:
-
Expenses Suite
-
Funding Suite
-
Sources of Funds
Out of the Box Dashboard Interface
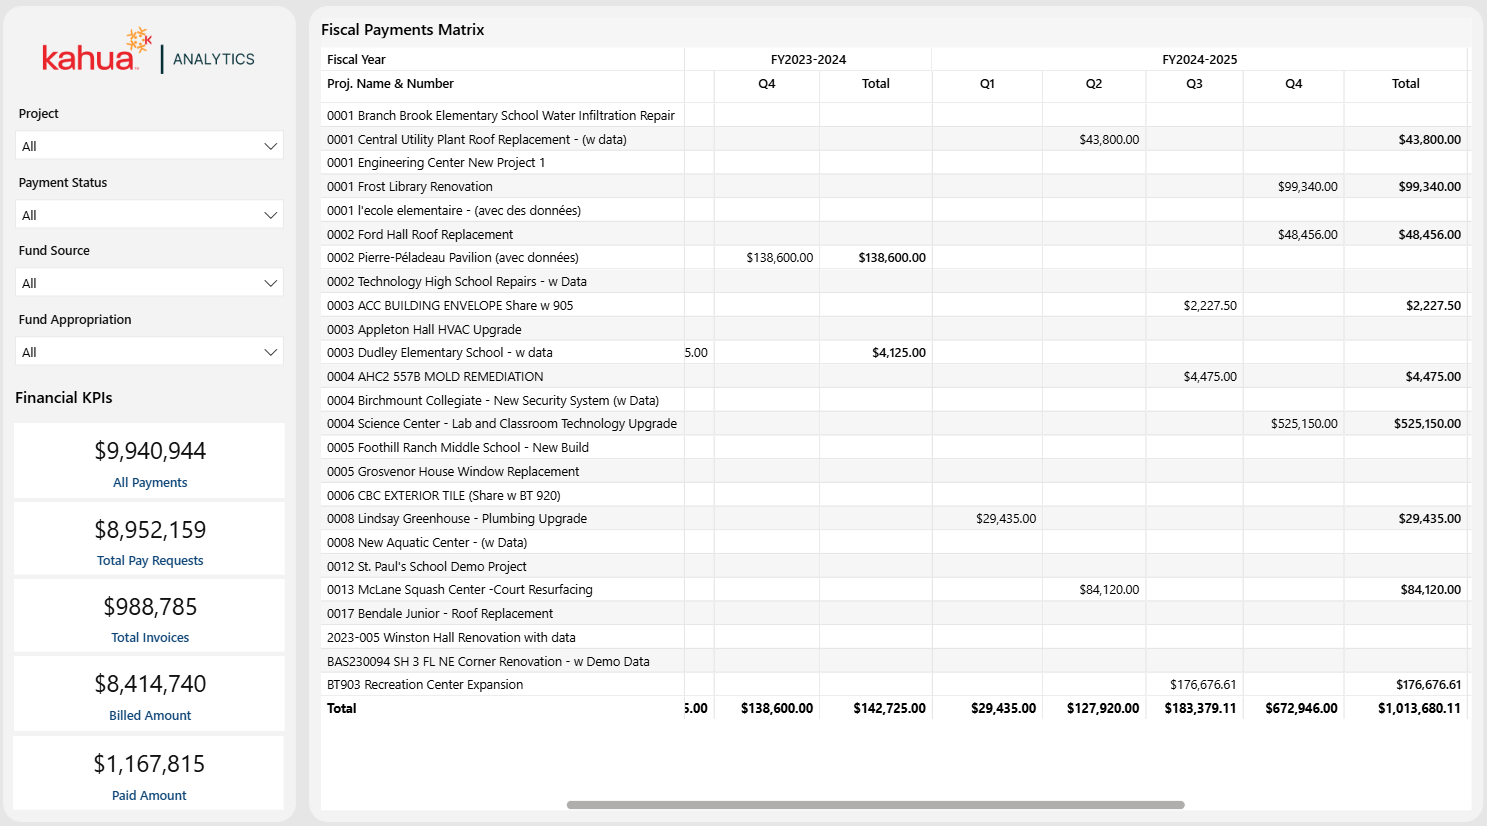
The Fiscal Period Payments Dashboard shows a matrix view of Invoices & Pay Requests over time. While the matrix focuses on payment totals, the user can filter to only see projects associated with specific fund sources or fund appropriations.
Description
The Fiscal Period Payments Dashboard summarizes payments at a program level. These are based on a district’s pre-defined monthly, quarterly, and annual fiscal periods. Dynamic filtering allows users to view their financials across multiple fiscal periods at a project, funding source, or program level.
Problem
Districts need multi-project payment reporting across multiple fiscal periods to balance out their cashflows. With limited resources, it can take days to export and compile across hundreds of projects.
Benefit
This dashboard provides real-time project payment summaries. These are at the district’s pre-defined fiscal periods, thus aligning directly with their cashflow reporting. With the ability to easily export all payments by these periods, districts can view and present their records in various formats.
The following apps are necessary to utilize this dashboard:
-
Portfolio Manager
-
Sources of Funds
-
Invoices
-
Pay Requests
Out of the Box Dashboard Interface
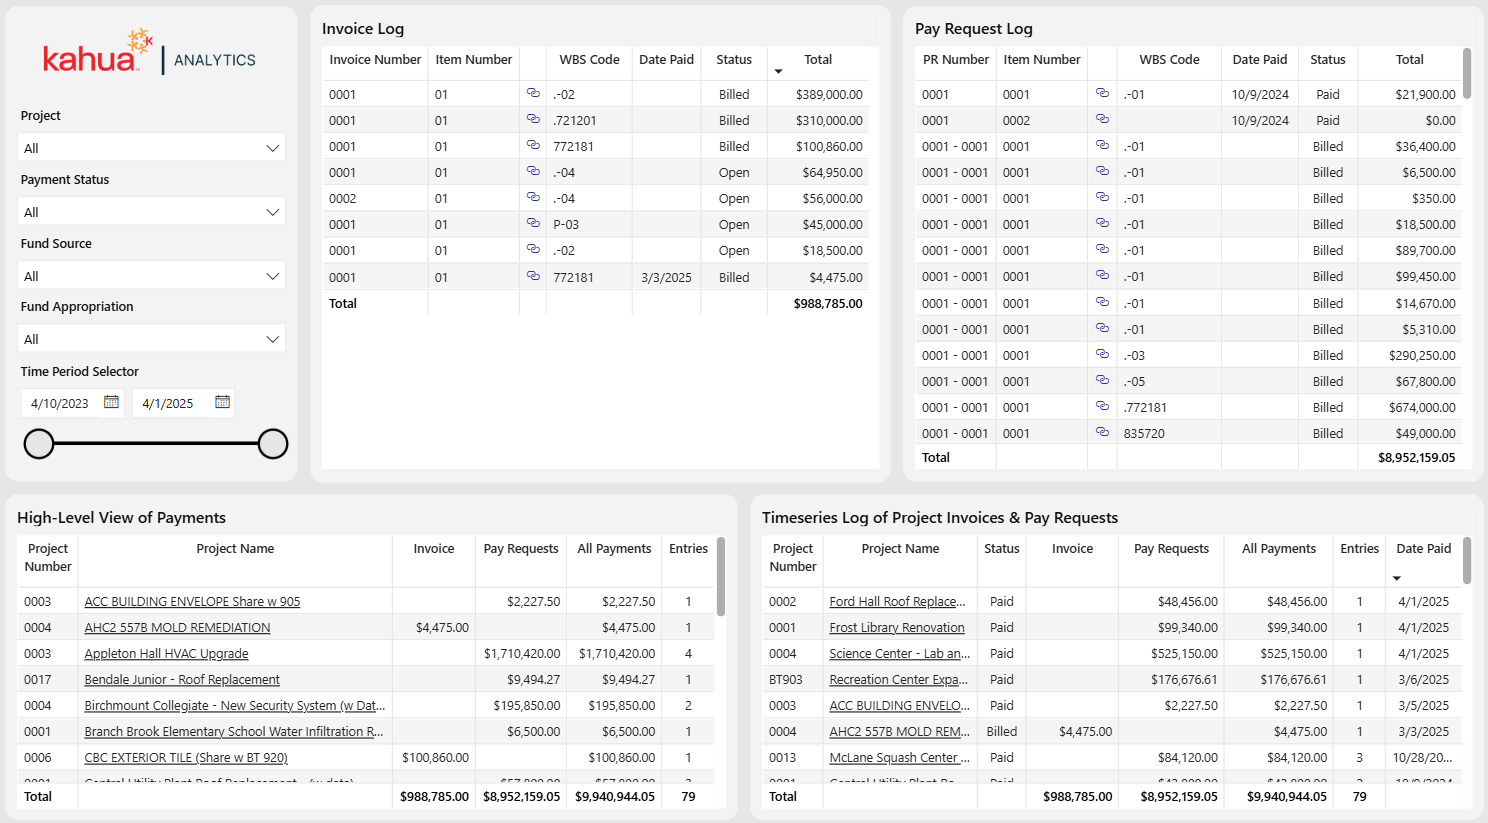
The Invoices & Pay Requests Dashboard shows a project-level view of all invoices or pay requests. Within this project level view, the user can dynamically filter the dashboard to see a log of every individual payment the WBS code, date, status, and amount associated with each.
Description
This dashboard allows users to view individual payment records for a desired time period. With dynamic filtering, users can filter by status, funding source, project, or program.
Problem
It is often helpful for districts to have checks and balances within their project management software between fiscal periods. They require quick access to the status of different payment records across multiple projects. With limited resources, the export and compilation of this information is time-consuming.
Benefit
With this dashboard, users can filter down to specific payment records at a project or program level. This allows them to display accurate and detailed financial information to key stakeholders or auditors.
The following apps are necessary to utilize this dashboard:
-
Portfolio Manager
-
Sources of Funds
-
Invoices
-
Pay Requests
Out of the Box Dashboard Interface
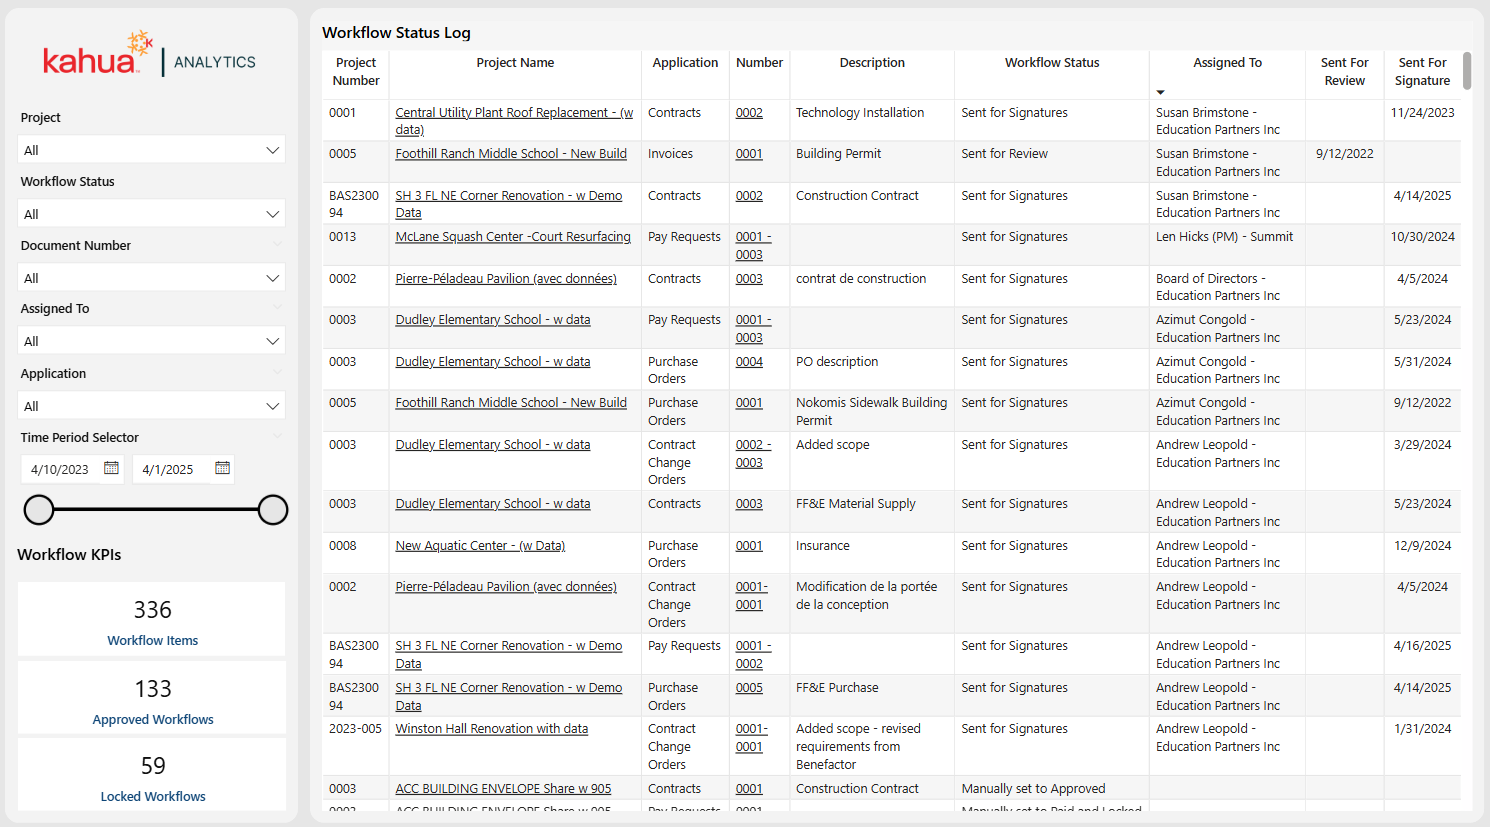
The Workflow Status Log Dashboard captures all items across a variety of Kahua Cost and Funding apps that go through an approval process. Through filtering by status, project name, date sent, and who the item is assigned to, project managers and team members can quickly pinpoint stalled items, track accountability for reviews, and maintain a timely approval pipeline.
Description
This dashboard is a compilation of thousands of records within cost and funding applications, and it displays key details for each record. This includes the project number and name, applicable application, and workflow status. Users can also see whether an item has been sent for review or signature, and the associated send dates.
Problem
Districts often have thousands of documents associated with a program. Their sheer number makes it difficult to keep track of them and can lead to them becoming lost.
Benefit
This dashboard provides insight into the individuals currently assigned to items. With thousands of documents being circulated over multiple projects, it is imperative to keep documents moving through the review and signature workflow process. This allows users to notice and address bottlenecks, thus mitigating risks to the project schedule.
The following apps are necessary to utilize this dashboard:
-
Portfolio Manager
-
Expense Suite
-
Funding Suite
Out of the Box Dashboard Interface
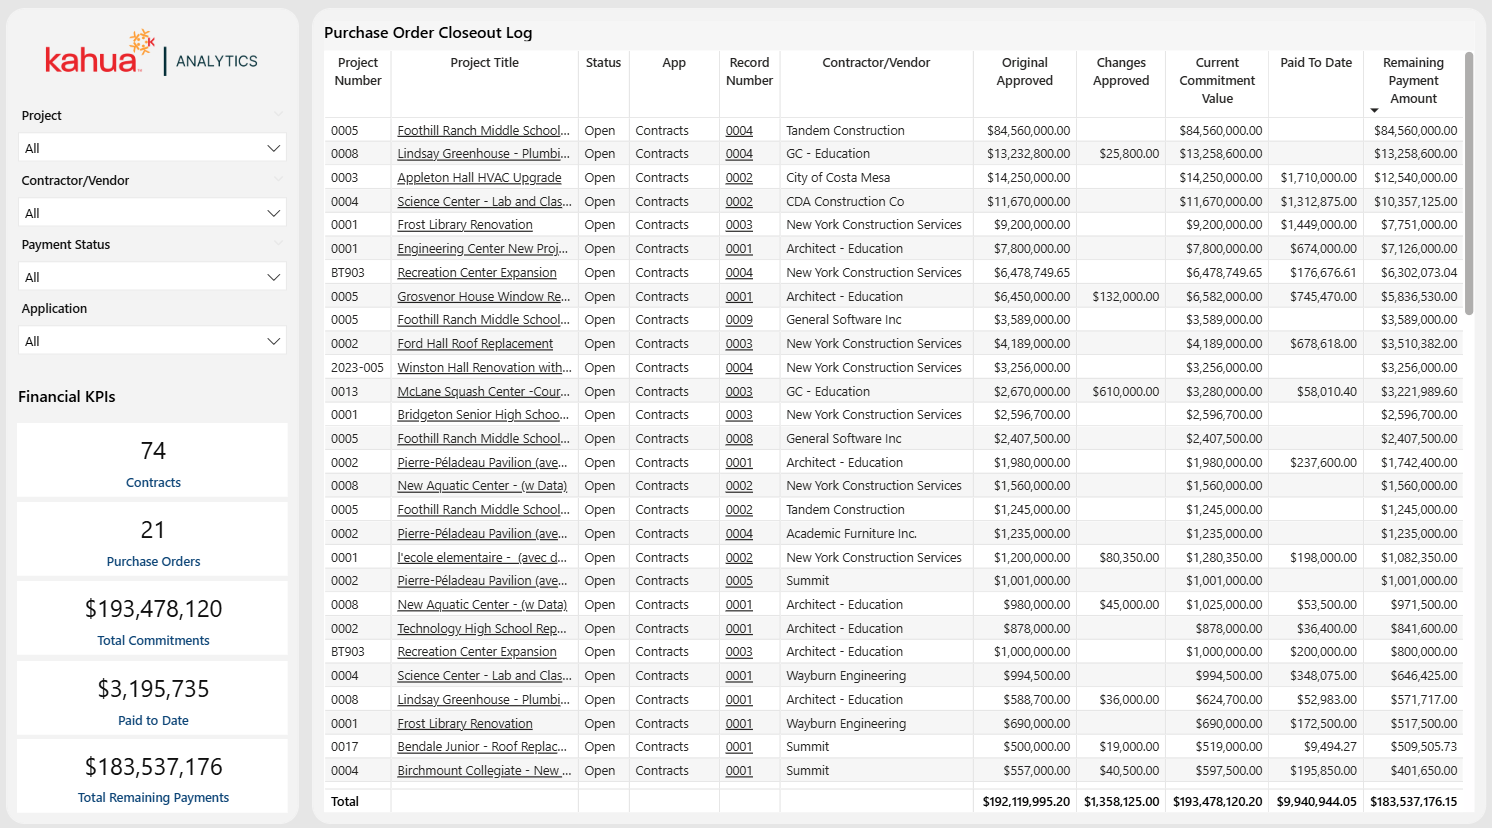
The Purchase Order (PO) Closeout Dashboard provides a consolidated view of all contract and purchase order data, along with their associated vendors. With the ability to filter by payment status, application, project, and contractor/vendor, users can gain a comprehensive look into the details of their contracts and purchase orders. Furthermore, from this dashboard, they can navigate to any desired contract or purchase order within the Kahua software.
Description
This dashboard compiles all outstanding contract and purchase order amounts into a single view to highlight the remaining payment amounts before a project closes out.
Problem
District managers often have low project closeout visibility in relation to their outstanding contracts.
Benefit
With this dashboard, users can enjoy improved visibility into outstanding obligations on contracts and purchase orders, as well as an overview of project financial closeout metrics.
The following apps are necessary to utilize this dashboard:
-
Portfolio Manager
-
Contracts
-
Contract Change Orders (COs)
-
Purchase Orders
-
Invoices
-
Pay Requests
Out of the Box Dashboard Interface
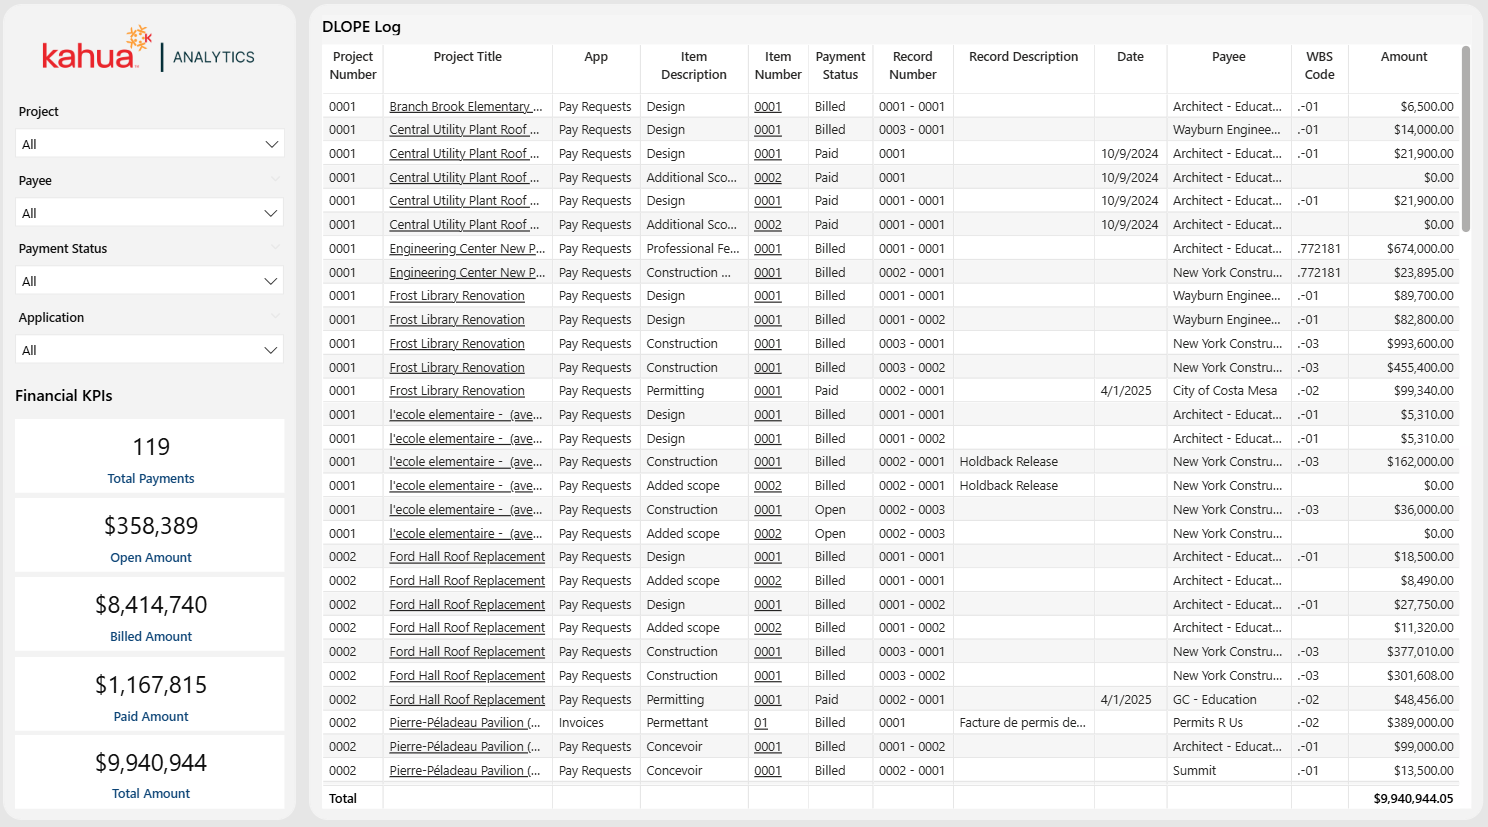
The Detailed Listing of Project Expenditures (DLOPE) Dashboard provides a view of invoice and pay request data with associated vendors. With fields displaying project status, the applicable app, item number, and payee, users can enjoy a detailed look into their invoices and pay requests. Additionally, they can navigate directly to any desired records directly from Kahua Analytics.
Description
This dashboard is an export-ready, detailed view into invoices and pay requests. It enables users to quickly extract important fiscal payment data for audit and monthly closings.
Problem
Districts must provide standardized cost reports to their auditors. With itemized details and references to internal cost codes, these reports take large amounts of time and resources to create.
Benefit
This dashboard provides a single source of truth for all expense items within a school system's Kahua domain. It allows the user to tailor the data set to their auditing needs, then easily export it to Excel. The export contains the underlying filters and contextual information that enables others to recreate the same report.
The following apps are necessary to utilize this dashboard:
-
Portfolio Manager
-
Invoices
-
Pay Requests
Out of the Box Dashboard Interface
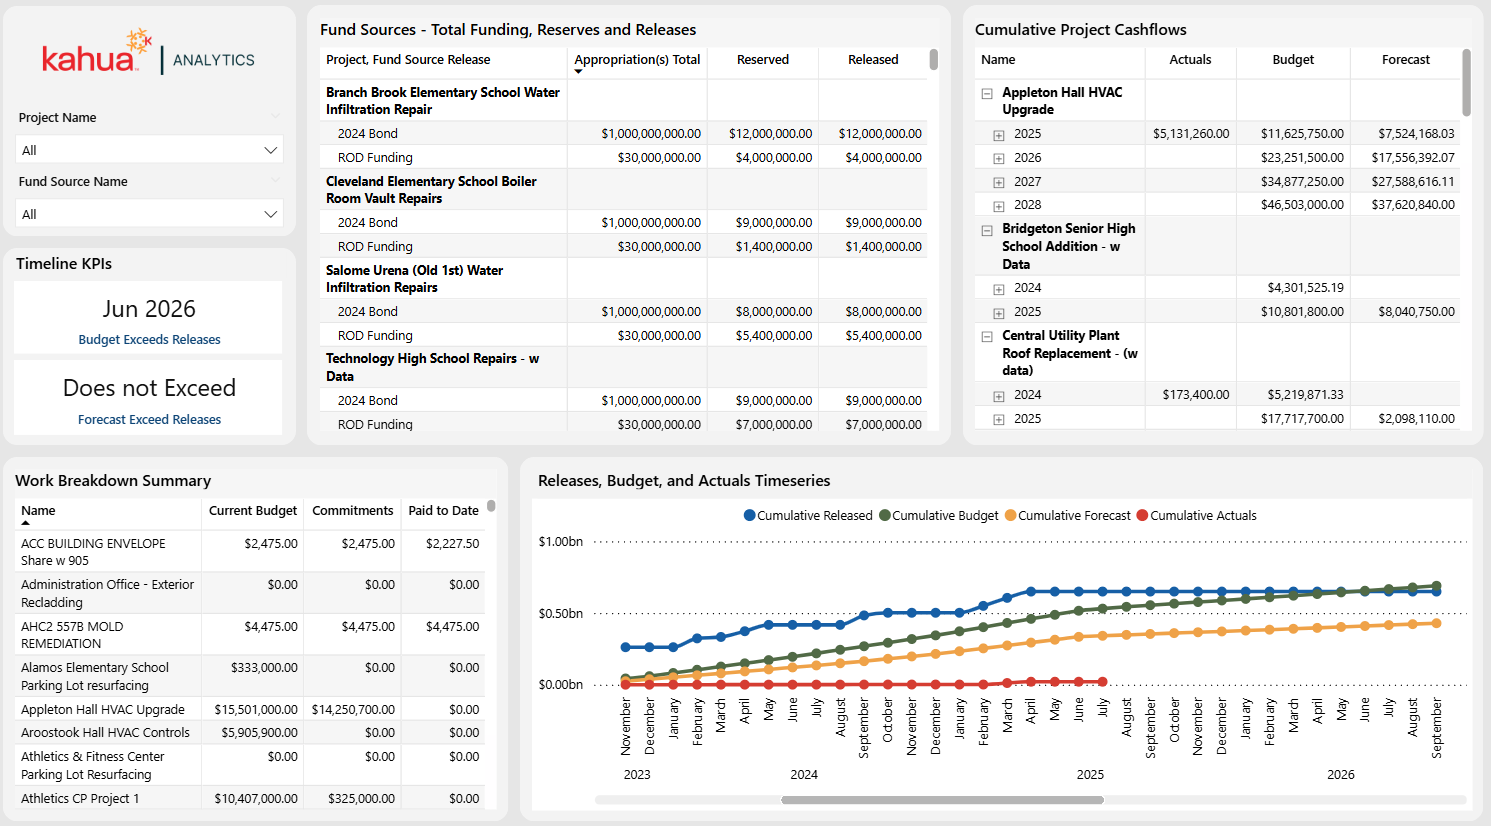
The Funding Streams Overview Dashboard compares cashflow forecasts with sources of funds. This allows users to determine when and how capital funds are being used — either on a singular project or across a portfolio. It allows them to know when their funds will run out. Furthermore, a timeseries chart displays funding releases against budgets, forecast expenses, and actuals, alerting owners of when to add or adjust funding.
Description
This dashboard compares cashflow forecasts with sources of funds. Intended to help users with forecasting and financial allocation, it displays information on the WBS Summary, Fund Sources, Budget, and Cumulative Project Cashflows. Thus, users are informed of the state of their funding across a portfolio or multiple projects.
Problem
It is vital for districts to know where money is being allocated, what is available, and where they might need more. Without this information, allocation planning can fall short, leading to funding shortfalls.
Benefit
This dashboard boasts detailed and comprehensive visuals that provide the necessary information for districts to stay on top of their financials. By highlighting the importance of financial allocation planning, it prevents funding shortfalls.
The following apps are necessary to utilize this dashboard:
-
Portfolio Manager
-
Cashflow Forecasting
-
Sources of Funds
-
Work Breakdown
Out of the Box Dashboard Interface
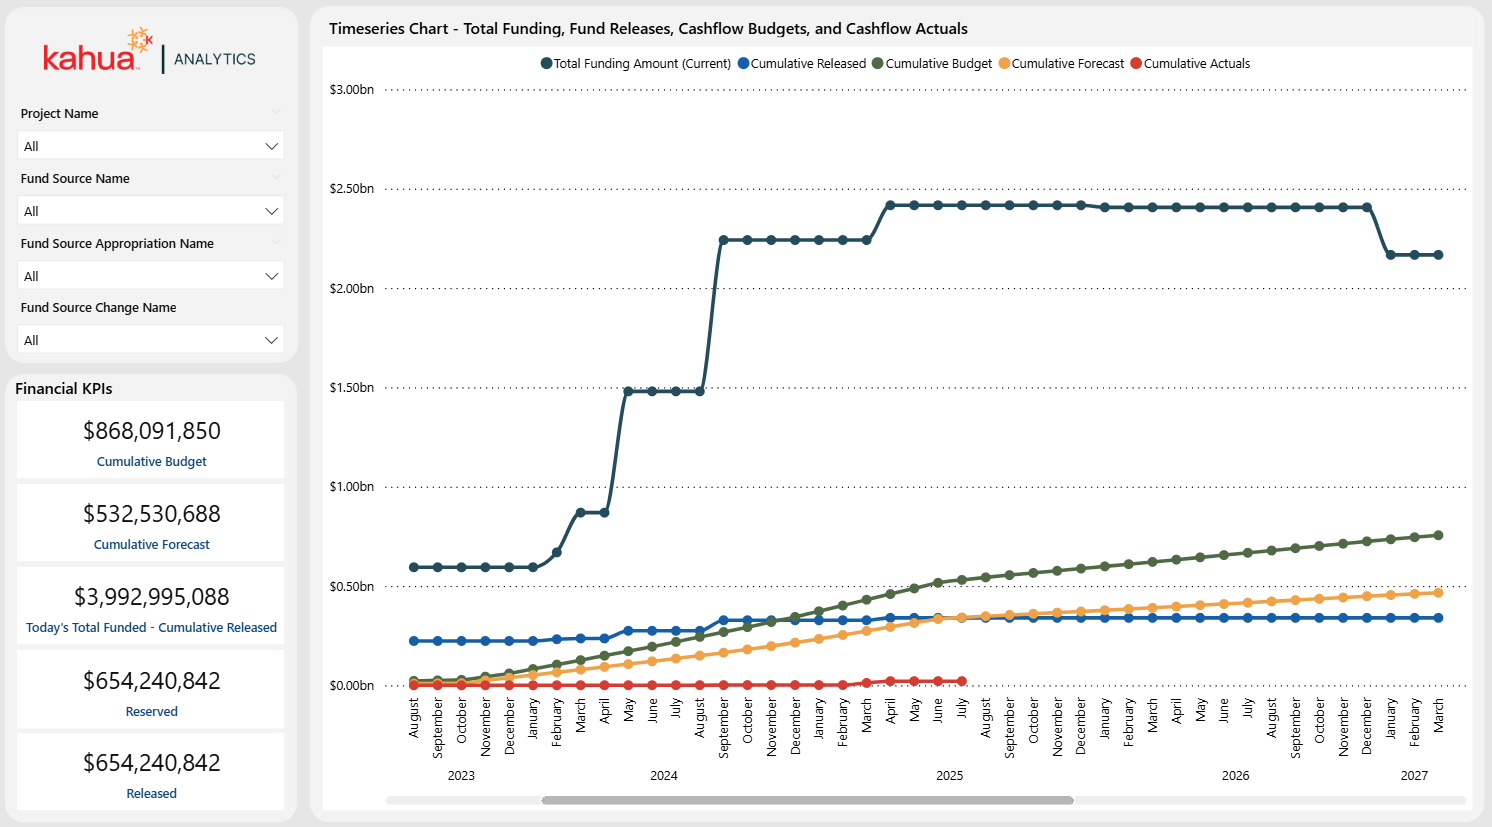
The Fund Monitor Dashboard expands on the Funding Streams Overview. With an enlarged timeseries chart and additional logic to show total funding amounts and ongoing releases, it allows users to view detailed financial data. Namely, they can see the difference between Total Funding, Releases, and cashflow totals. Users can filter by Project Name, Fund Source Name, and Fund Source Appropriation name, to gain a more granular look into project specifics.
Description
This dashboard delves deeper into the views the Funding Stream Overview Dashboard offers. With detailed visual breakdowns of how actuals, forecast expenses, budgets, and total funds stack up over time, it aims to support long-term financial planning.
Problem
It is vital for districts to know where money is being allocated, what is available, and where they might need more. Without this information, allocation planning can fall short, leading to funding shortfalls.
Benefit
This dashboard boasts visuals with even greater detail. This allows for powerful illumination of the financial state of projects. Thus, users can stay informed of their funding, as well as its sources. This way, they can enact informed plans for the future.
The following apps are necessary to utilize this dashboard:
-
Portfolio Manager
-
Cashflow Forecasting
-
Sources of Funds
-
Work Breakdown
Out of the Box Dashboard Interface