Kahua Analytics Subcontractor Package
The Kahua Analytics for Subcontractors Package offers a suite of dashboards for tracking projects, bids, service quotes, daily work reports, RFIs, submittals, change order requests, and safety activity.
Descriptions of each dashboard are detailed in the sections below:
Executive Dashboards
The Executive Dashboard category shows data from across a portfolio of projects. This allows for highlighting trends, determining health, and examining overall costs.
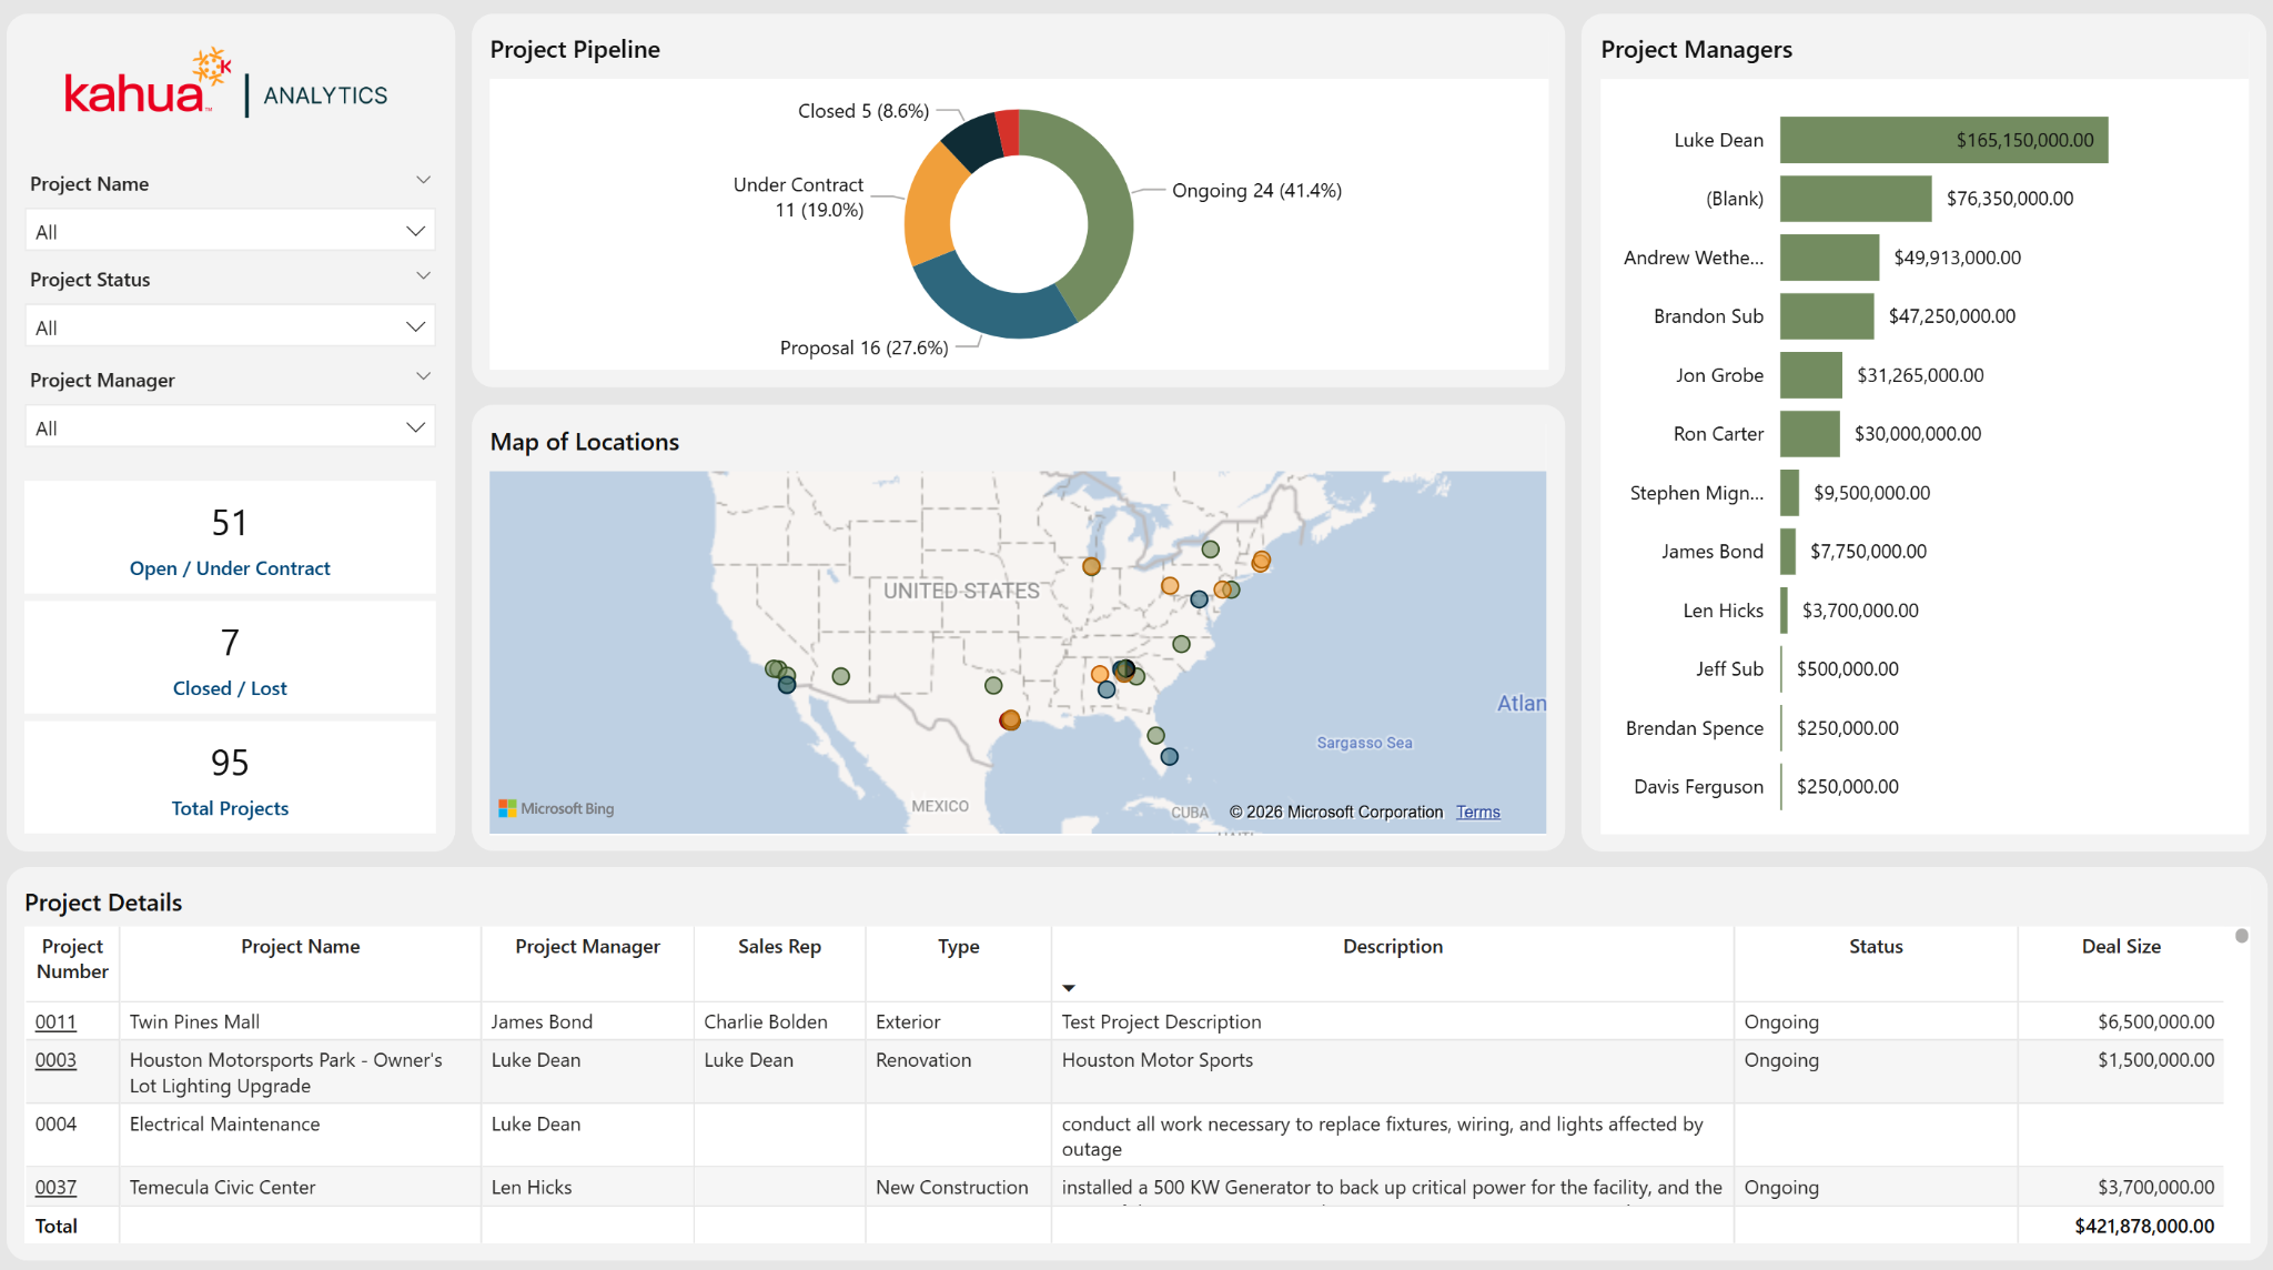
 Project Portfolio Summary
The Project Portfolio Summary Dashboard provides a comprehensive view of active projects across a portfolio. It brings together project locations, contract status, project managers, deal sizes, and detailed project information so teams can quickly understand workload, backlog, and overall portfolio health.
Description
This dashboard contains overall project insights such as location, status, and project manager.
Problem
With many projects and contracts across their portfolio and limited resources to compile the data they contain, it can be difficult for subcontractors to keep track of vital details. This can lead to missed context around the status of projects and the work they involve.
Benefit
Project Portfolio Summary offers visibility into project status and health. Subcontractors can focus on key metrics to enhance operational decision-making and quickly understand the full portfolio. They can also benefit from the ability to drill into specific project details.
The following apps are necessary to utilize this dashboard:
-
Portfolio Manager
-
Addresses
-
Contacts
-
People
-
Out of the Box Dashboard Interface
Project Financials
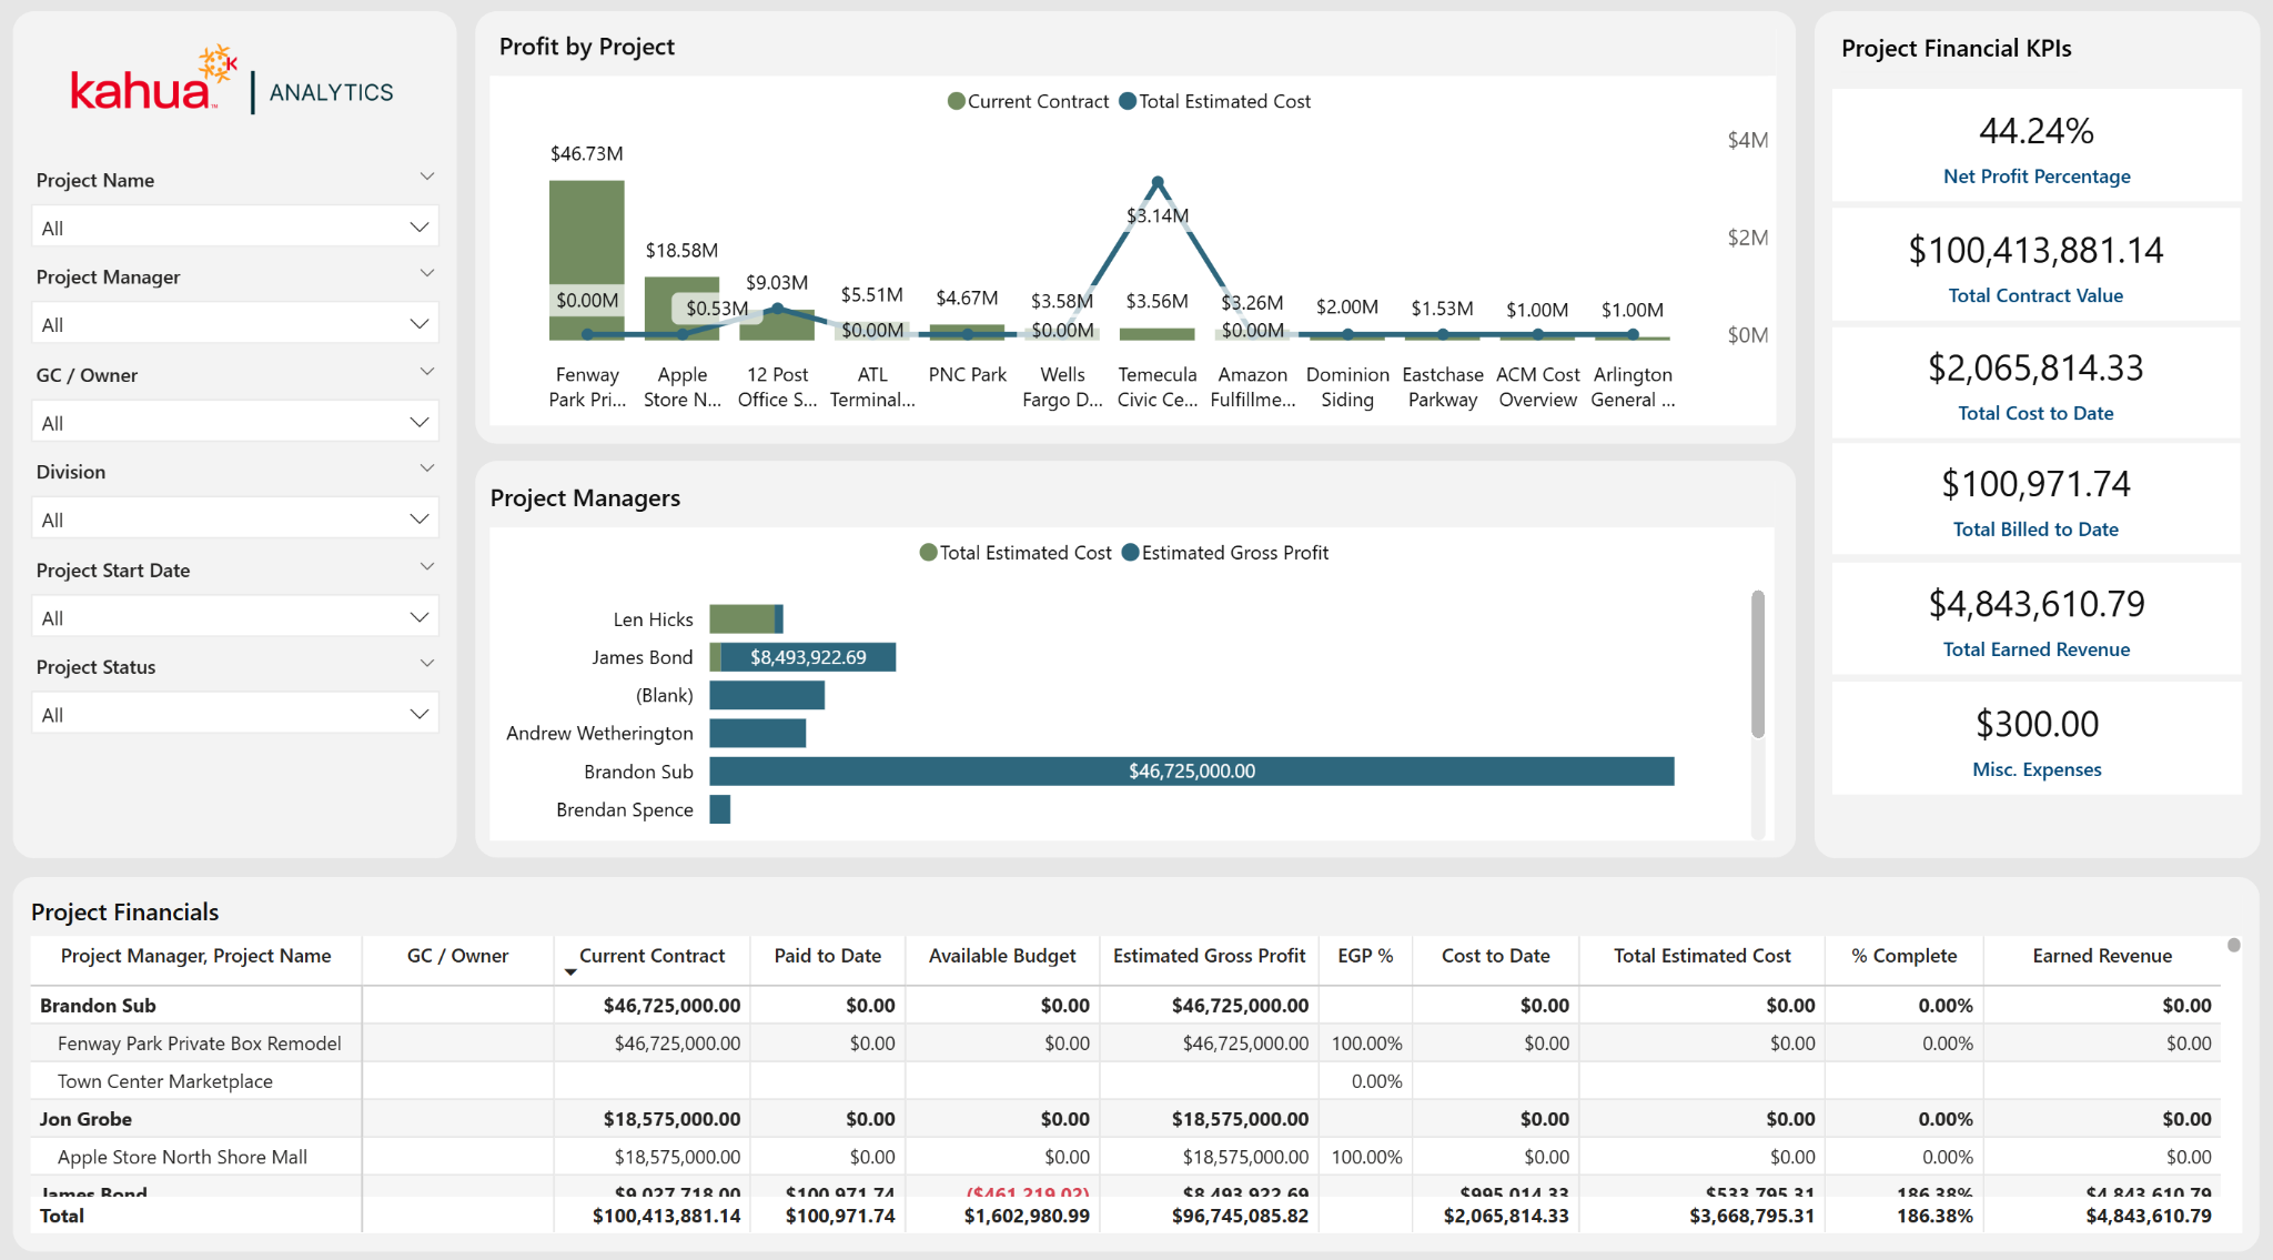
The Project Financials Dashboard displays financial information across all projects. It provides a high-level view, focusing on profits and costs. Subcontractors can use the data displayed here to gauge the profitability of projects, the health of their budget, and pinpoint financial risks before they grow.
Description
Project Financials showcases the profits and costs of contracted projects.
Problem
Projects are contracted for different monetary amounts. Keeping track of these across a portfolio can be challenging.
Benefit
This dashboard provides subcontractors with insights into each project's financial health.
The following apps are necessary to utilize this dashboard:
-
Portfolio Manager
-
Work Breakdown
-
Expenses Suite
-
Funding Suite
-
Contacts
-
People
-
Out of the Box Dashboard Interface
Projects by Marketing Type
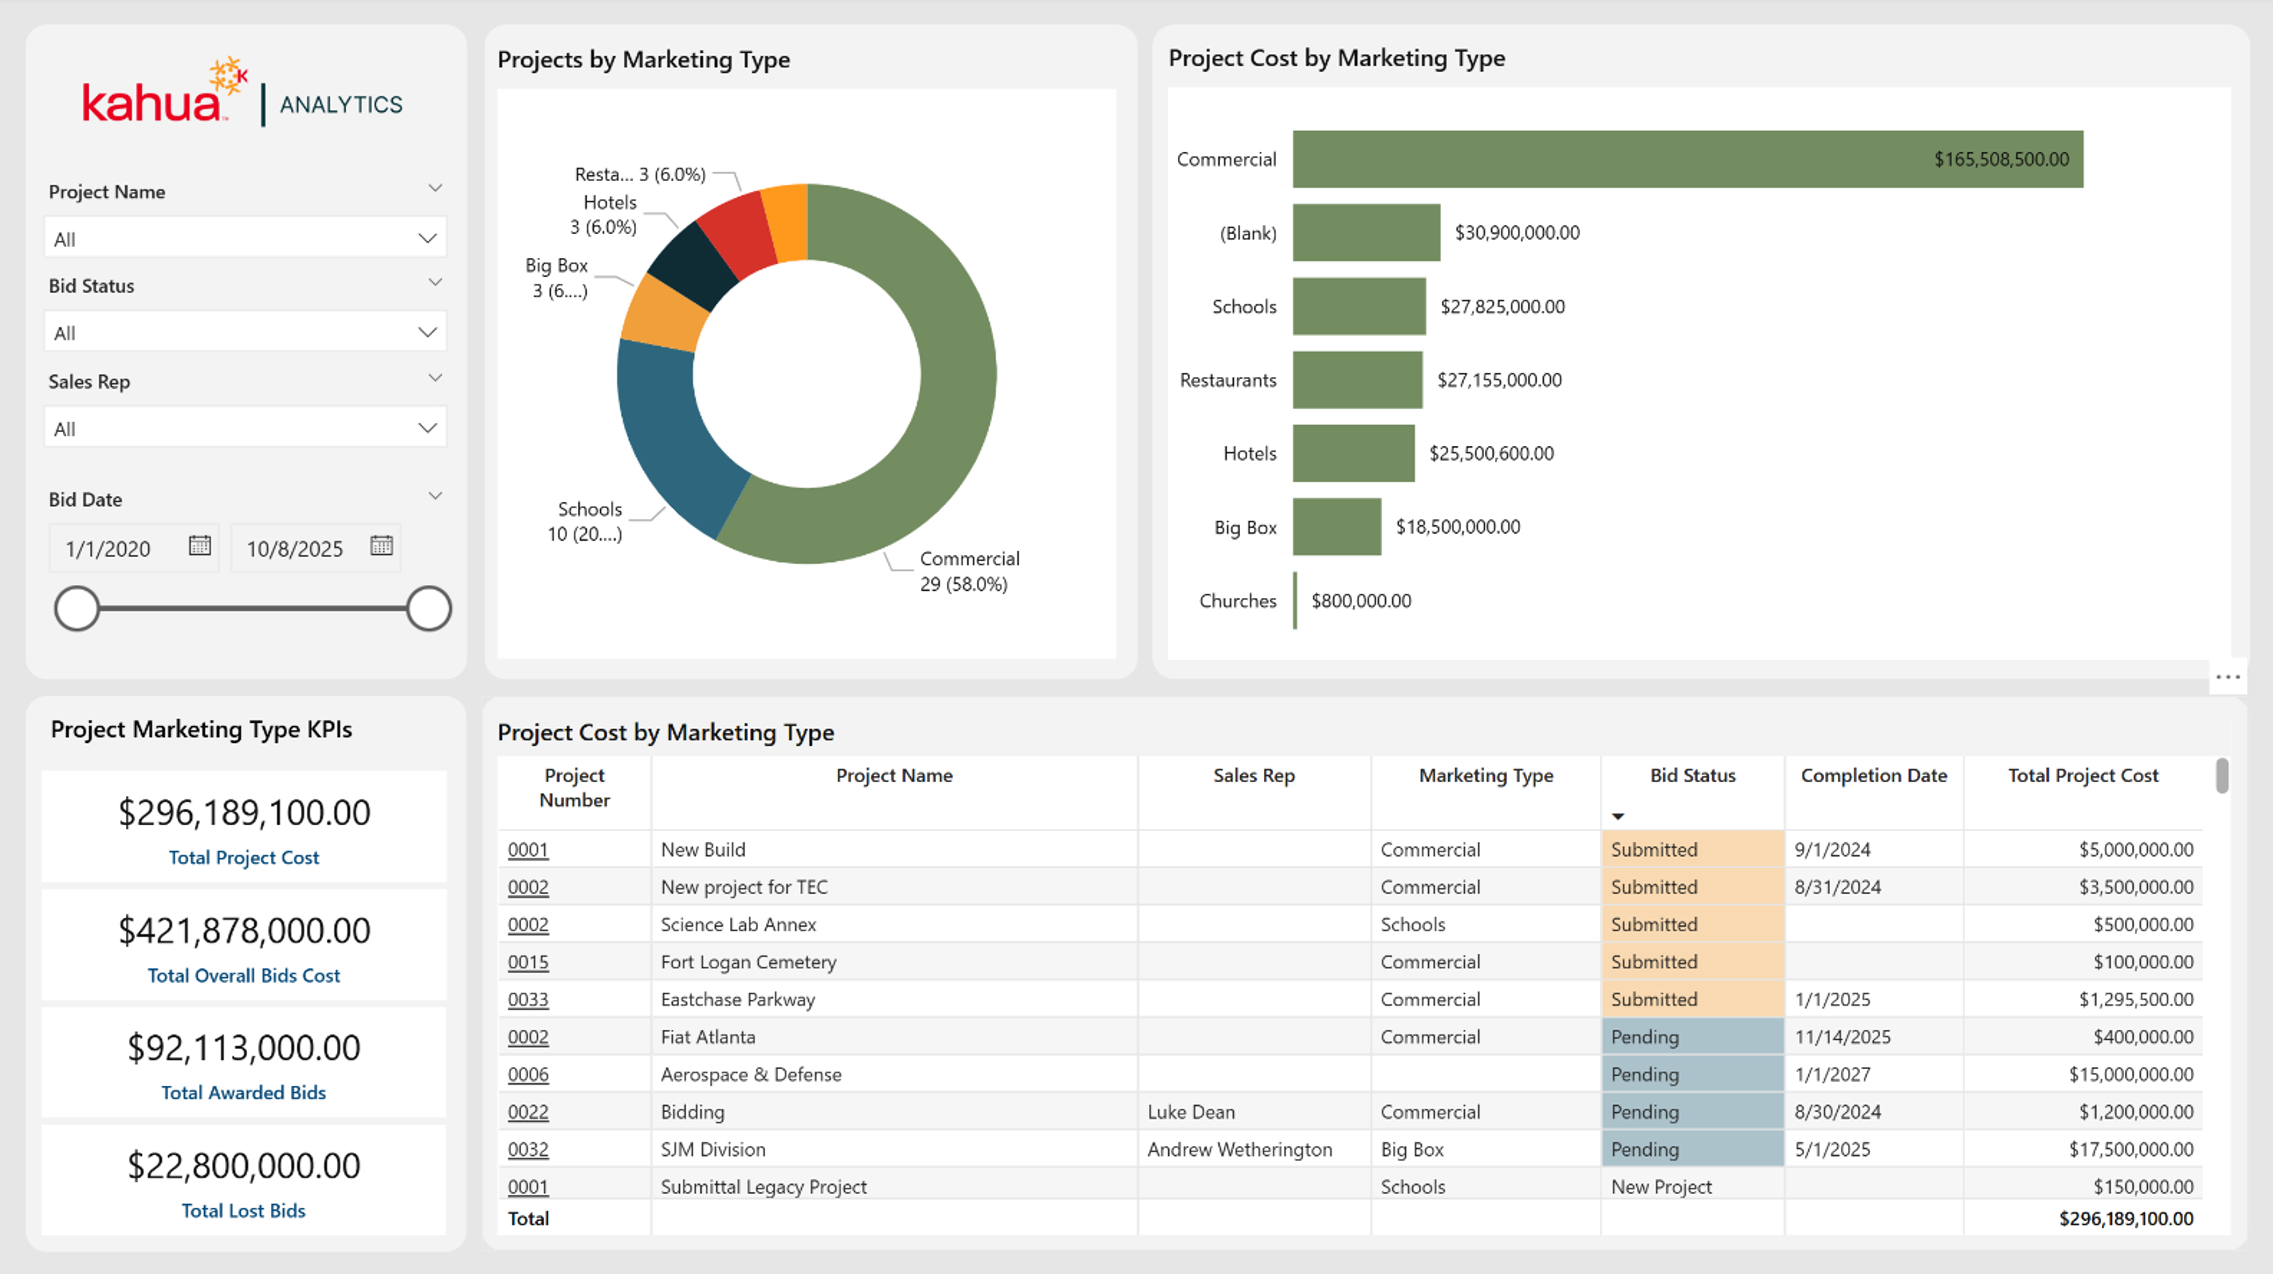
The Projects by Marketing Type Dashboard breaks down the costs associated with projects across verticals or marketing types. It also touches on bid statuses, showcasing their status and dollar totals.
Description
This dashboard illustrates which verticals produce the most successful and lucrative projects.
Problem
With multiple bids going at once, subcontractors can struggle to understand which markets they are most successful in so they can concentrate their efforts there.
Benefit
At a glance, subcontractors can tell what markets they should target. This allows them to make bidding decisions grounded in data.
The following apps are necessary to utilize this dashboard:
-
Portfolio Manager
-
Contacts
-
People
-
Out of the Box Dashboard Interface
Bid Status Report
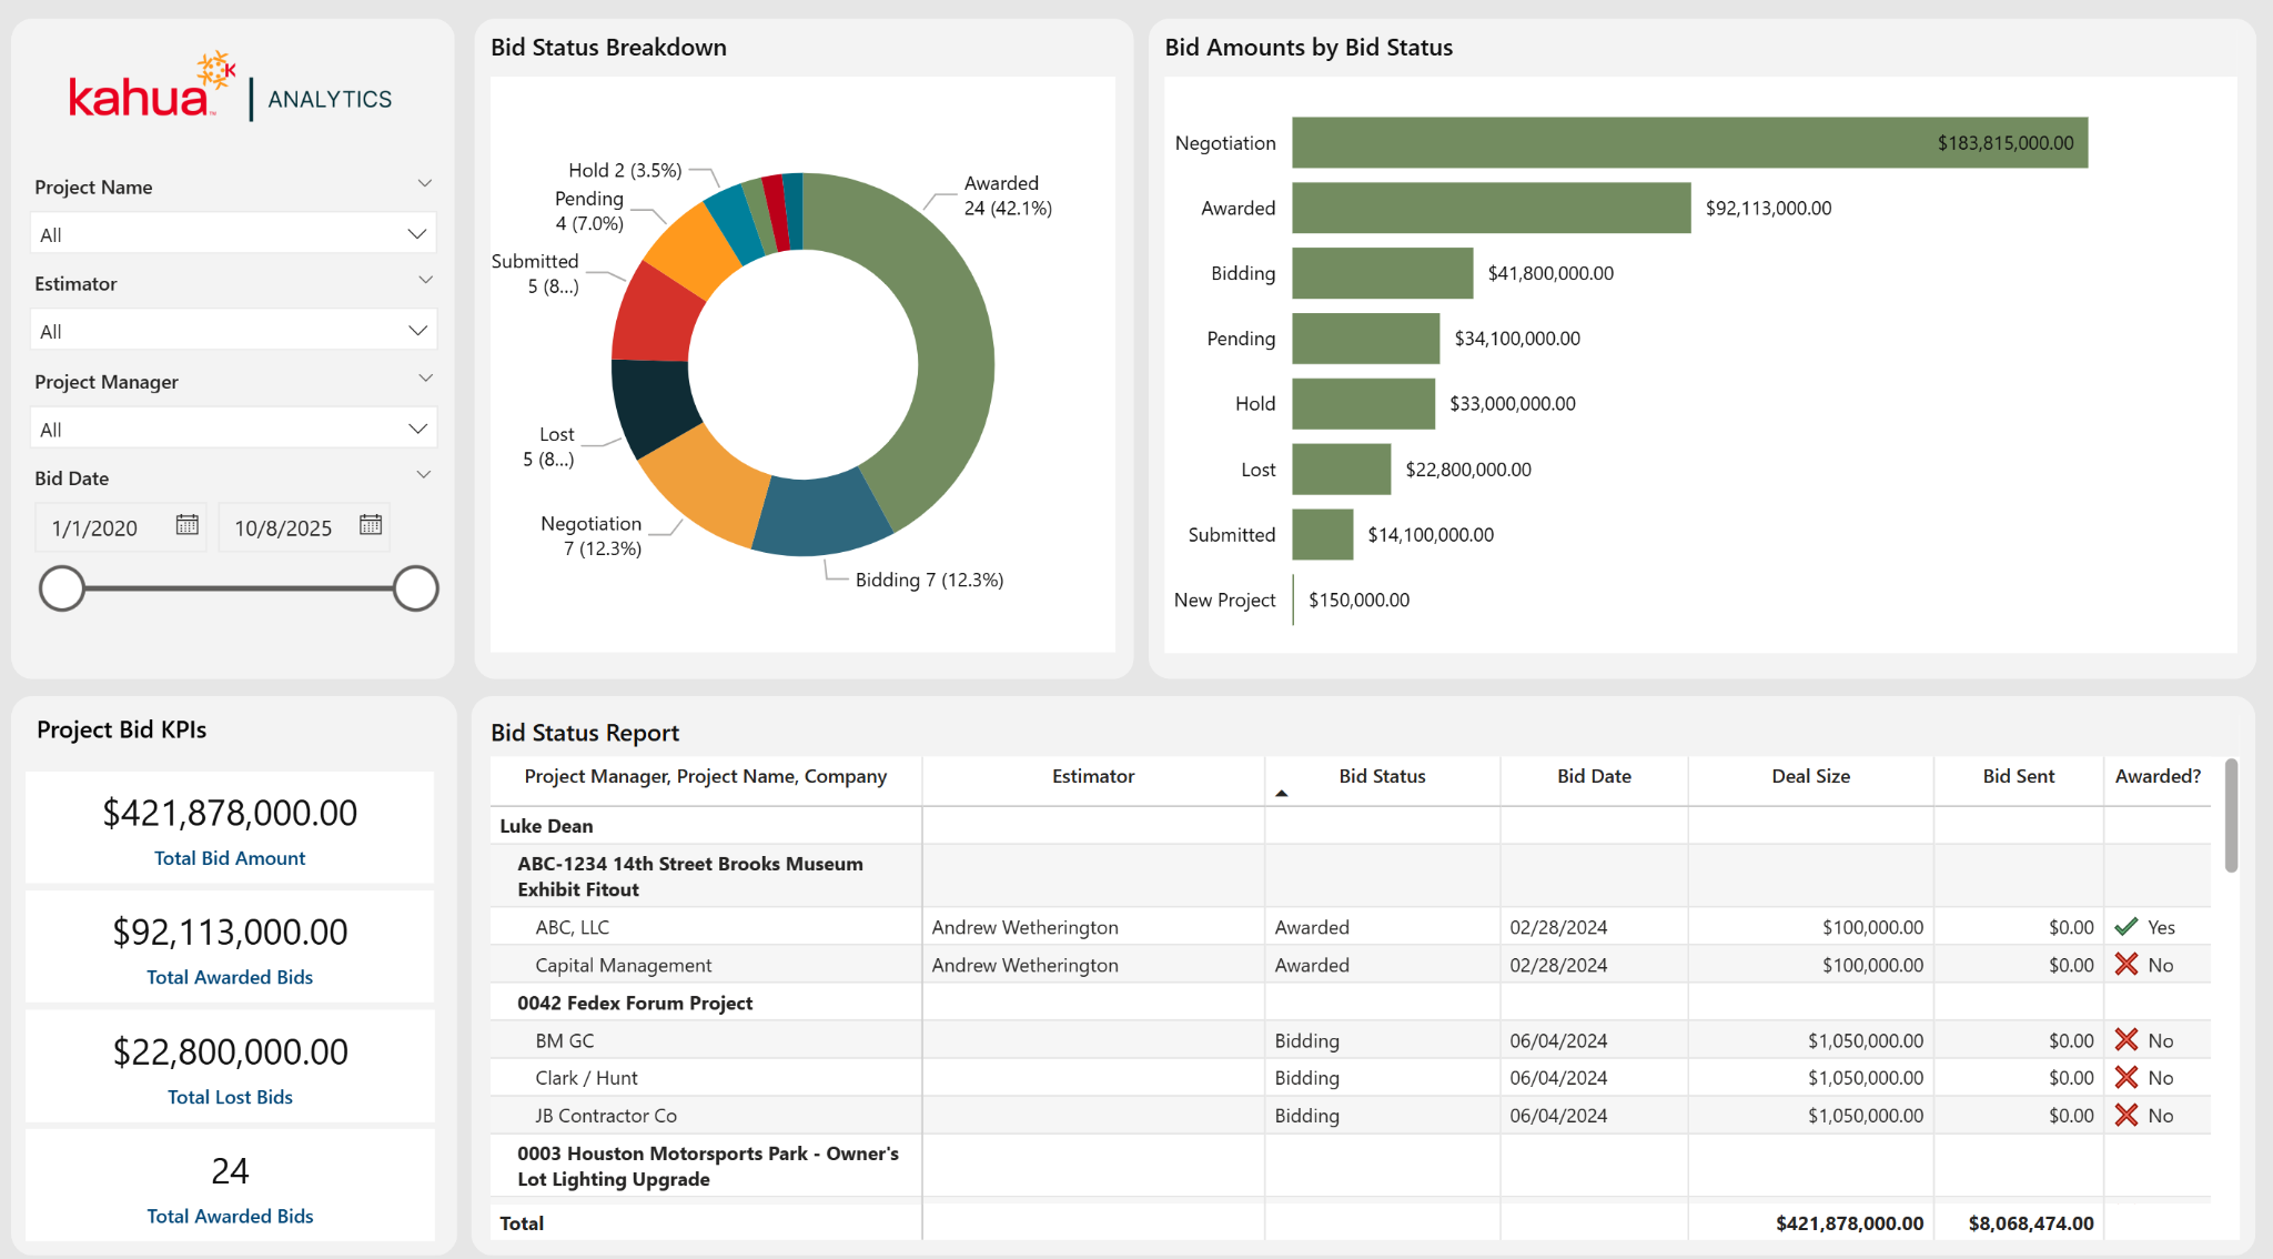
The Bid Status Report Dashboard provides a comprehensive overview of bidding performance. With visuals showing bid statuses and amounts, it offers insights into the effectiveness of bid strategies.
Description
Bid Status Report highlights the state of bids across the project portfolio.
Problem
Without a source of truth for their numerous bids, it can be difficult for subcontractors to stay up to date on bid status.
Benefit
This dashboard ensures subcontractors have a centralized hub where they can ascertain the success of their bids.
The following apps are necessary to utilize this dashboard:
-
Portfolio Manager
-
Contacts
-
Companies
-
People
-
Out of the Box Dashboard Interface
Estimator Metrics
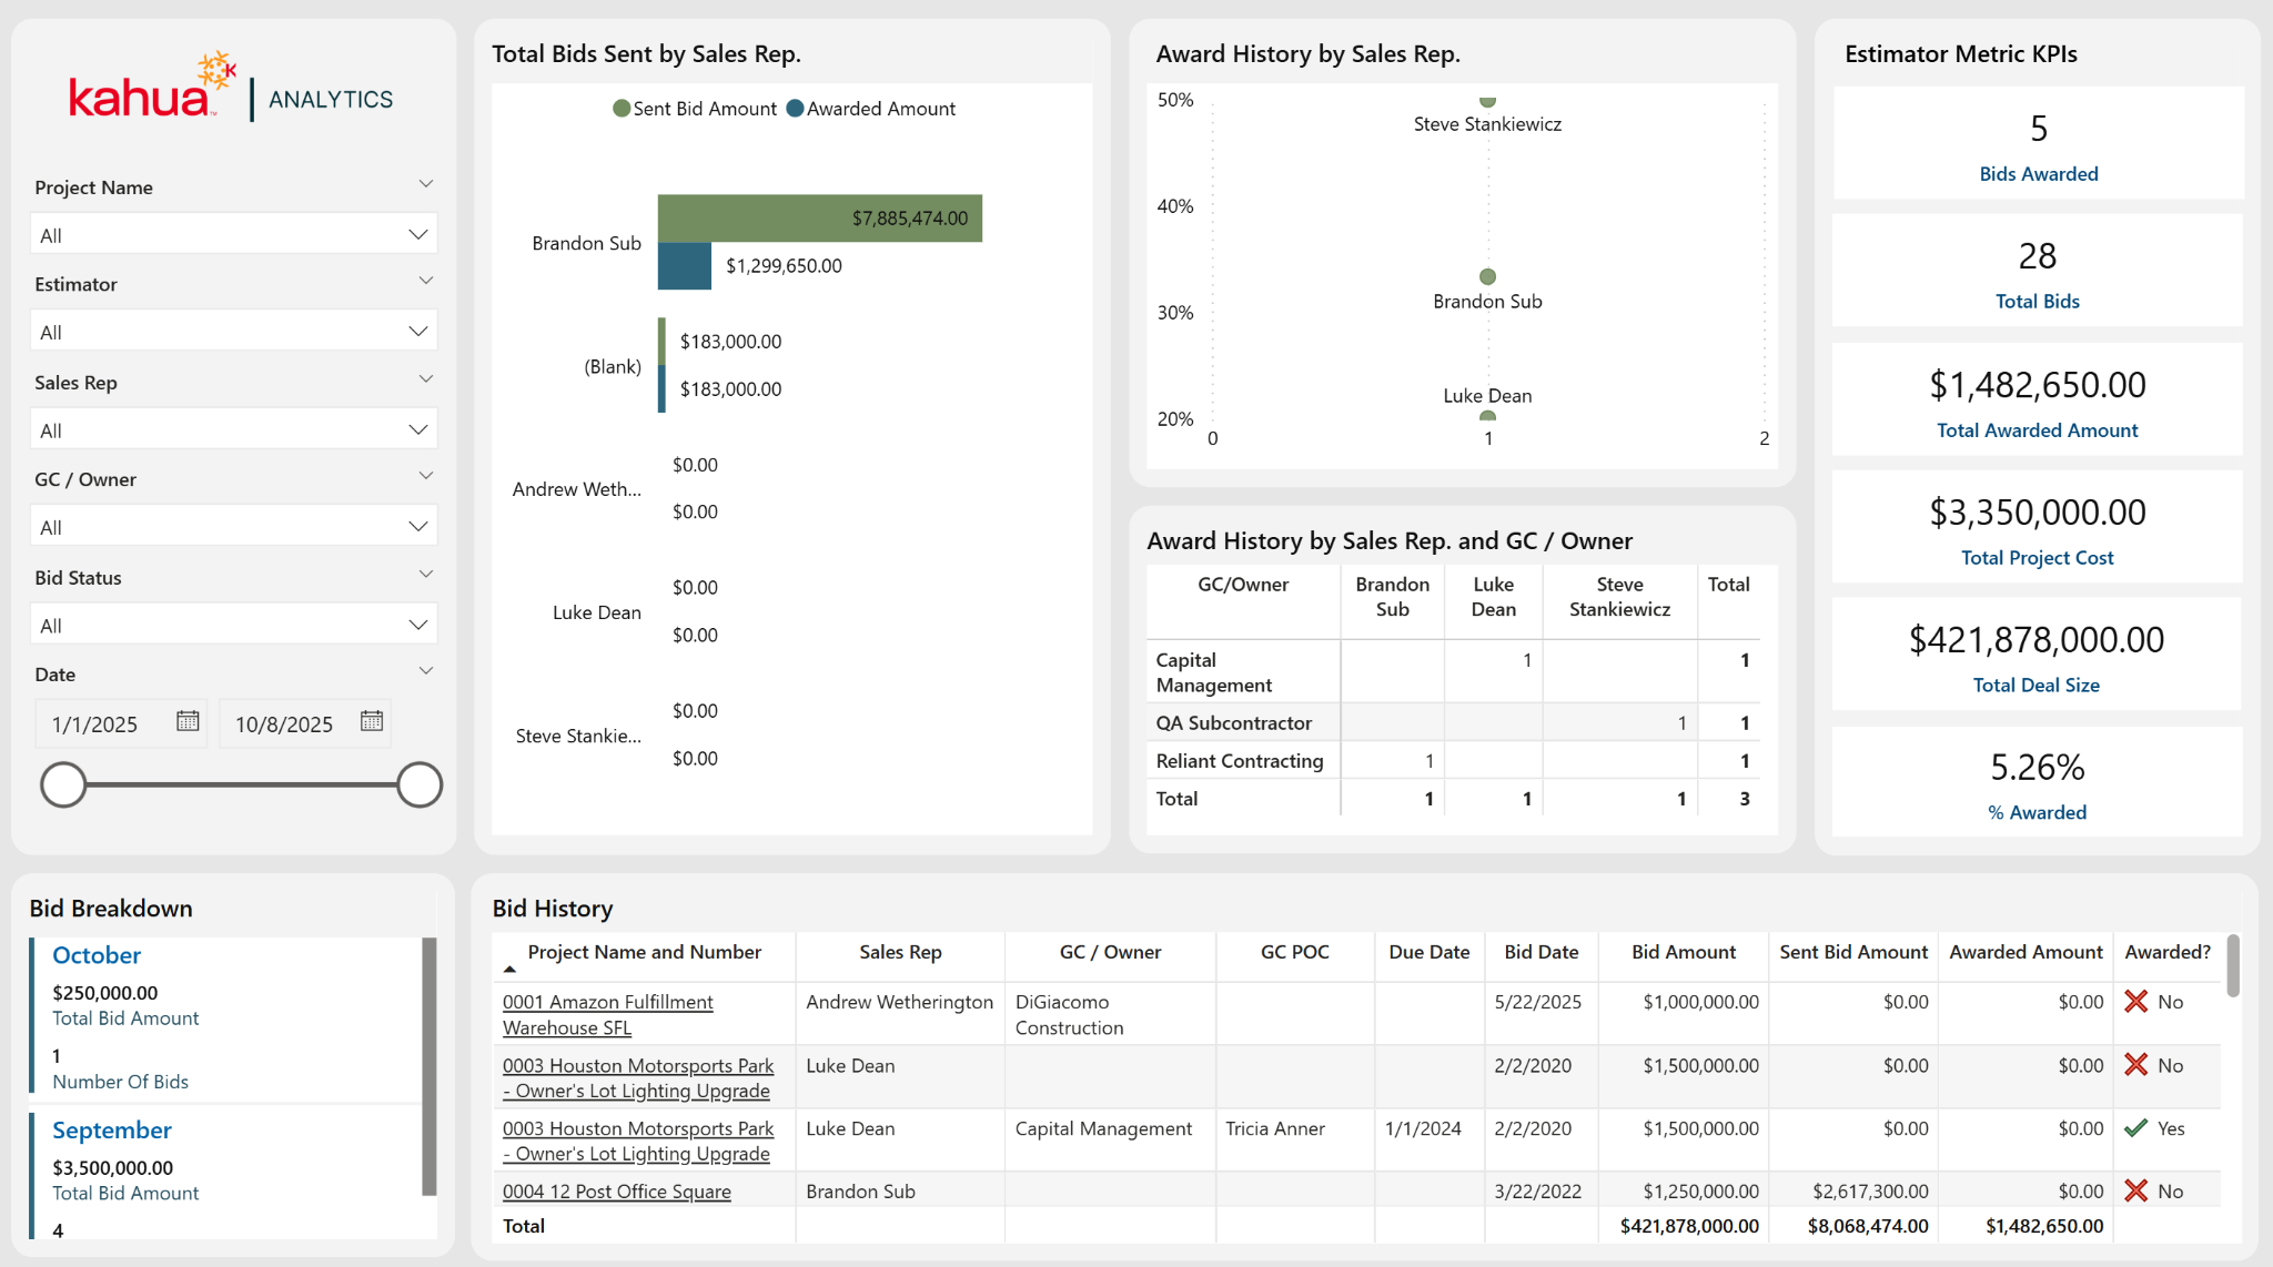
The Estimator Metrics Dashboard provides a detailed analysis of bidding activity, as well as the performance of those involved, like the GC and sales rep. It tracks the total deal size and awarded amounts, offering valuable insights into bidding performance and profitability.
Description
Estimator Metrics showcases the performance of estimators and sales representatives.
Problem
Without a consolidated view, it can be difficult to compare bid volume, award rate, and awarded amount across the team.
Benefit
This dashboard allows subcontractors to review estimator performance and bidding success in one place so they can identify sales rep success and necessary adjustments for future work.
The following apps are necessary to utilize this dashboard:
-
Portfolio Manager
-
Addresses
-
Contacts
-
Companies
-
People
-
Out of the Box Dashboard Interface
Safety - Injury/GL/Auto
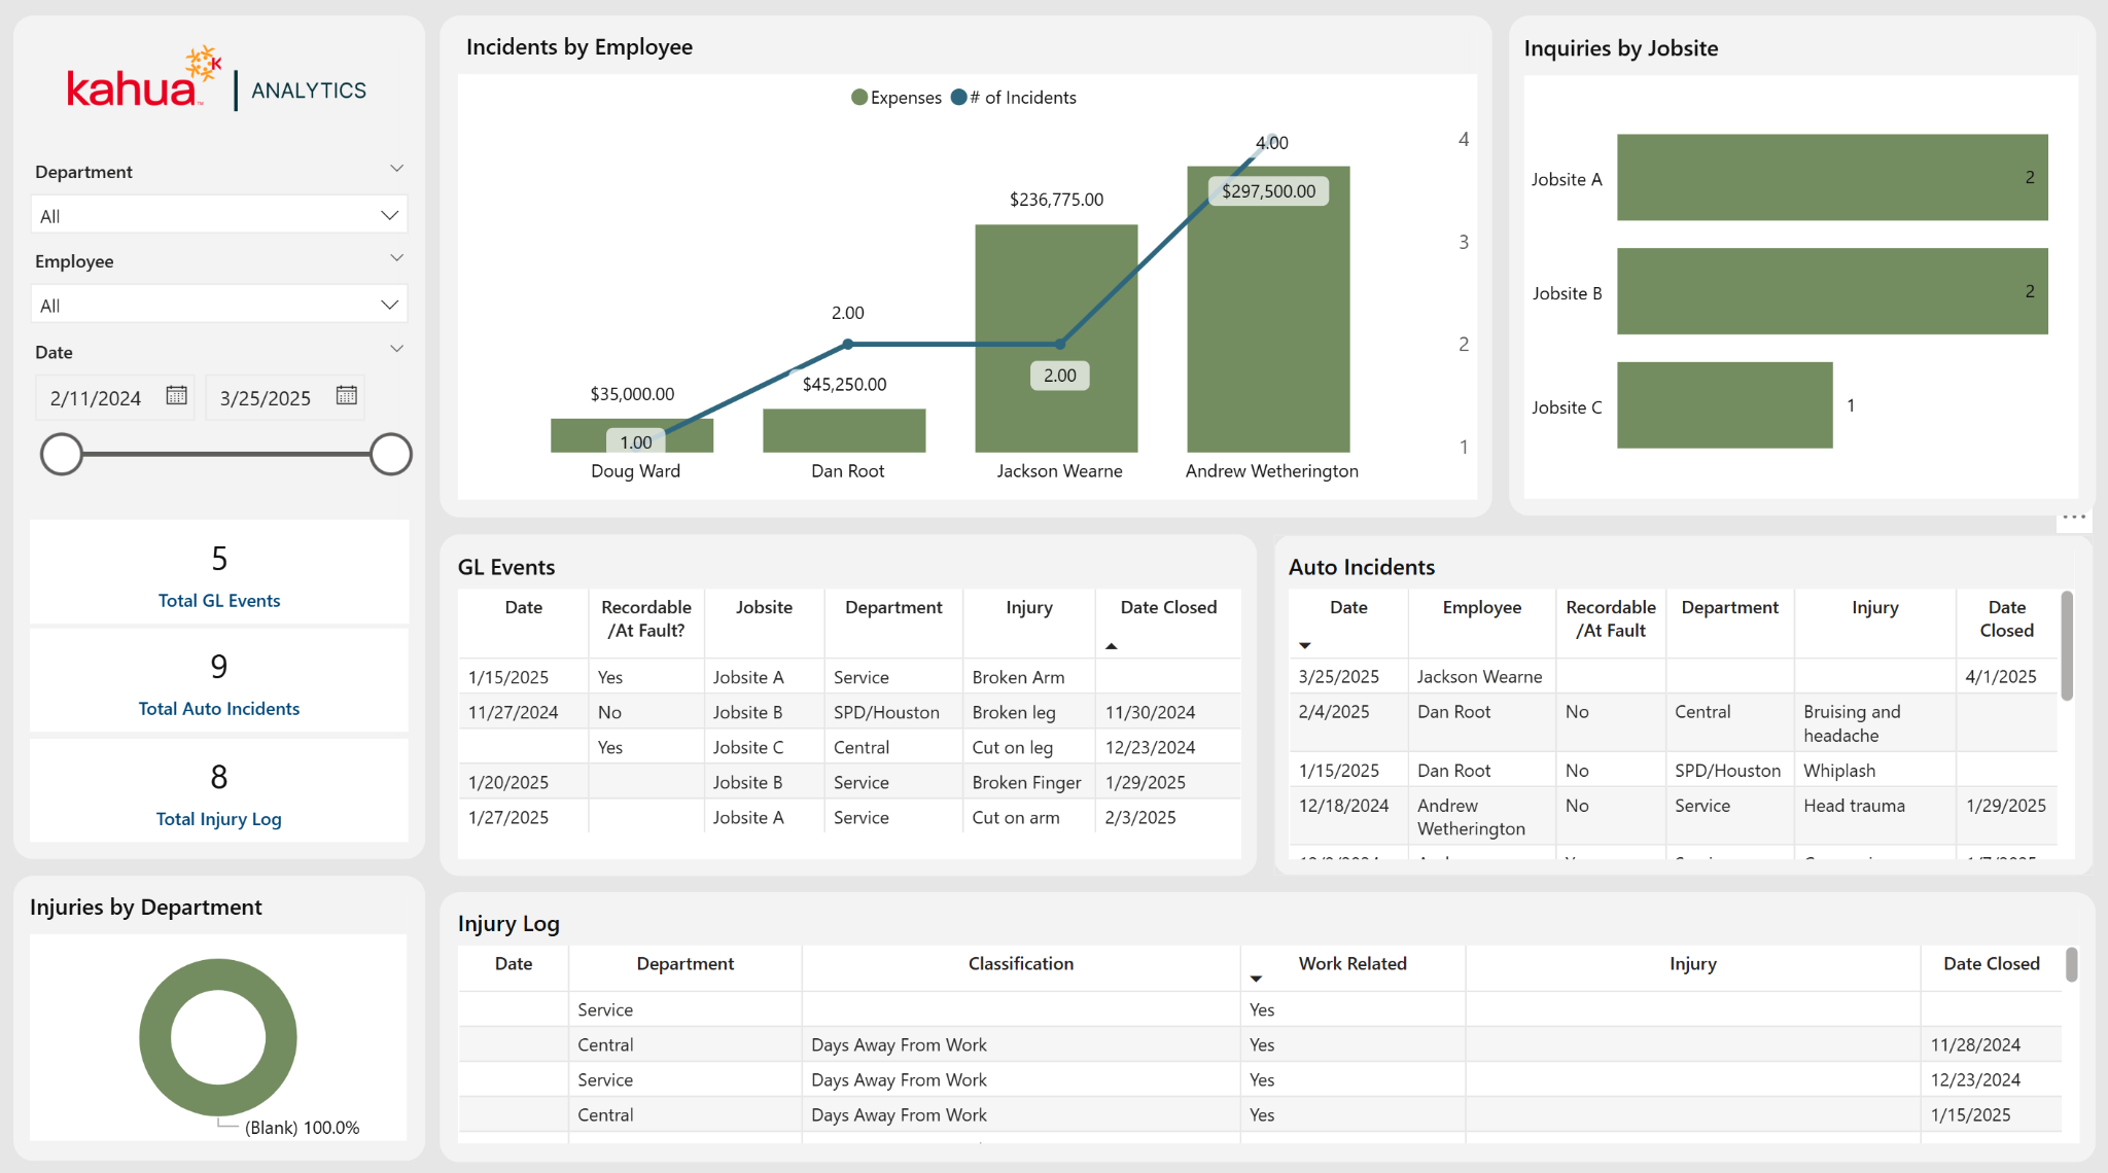
The Safety - Injury/GL/Auto Dashboard displays vital information regarding safety events. It provides visibility into general liability (GL) events, auto incidents, injury logs, and associated expenses.
Description
This dashboard enables subcontractors to monitor safety performance and risk management across projects.
Problem
Safety information can be scattered across different incident records and categories, making it difficult to understand incident trends.
Benefit
This dashboard centralizes safety data to improve safety oversight and help teams identify areas where additional attention may be needed.
The following apps are necessary to utilize this dashboard:
-
Portfolio Manager
-
Safety Suite
-
Contacts
-
People
-
Out of the Box Dashboard Interface
Safety - Toolbox Talks & Training Register
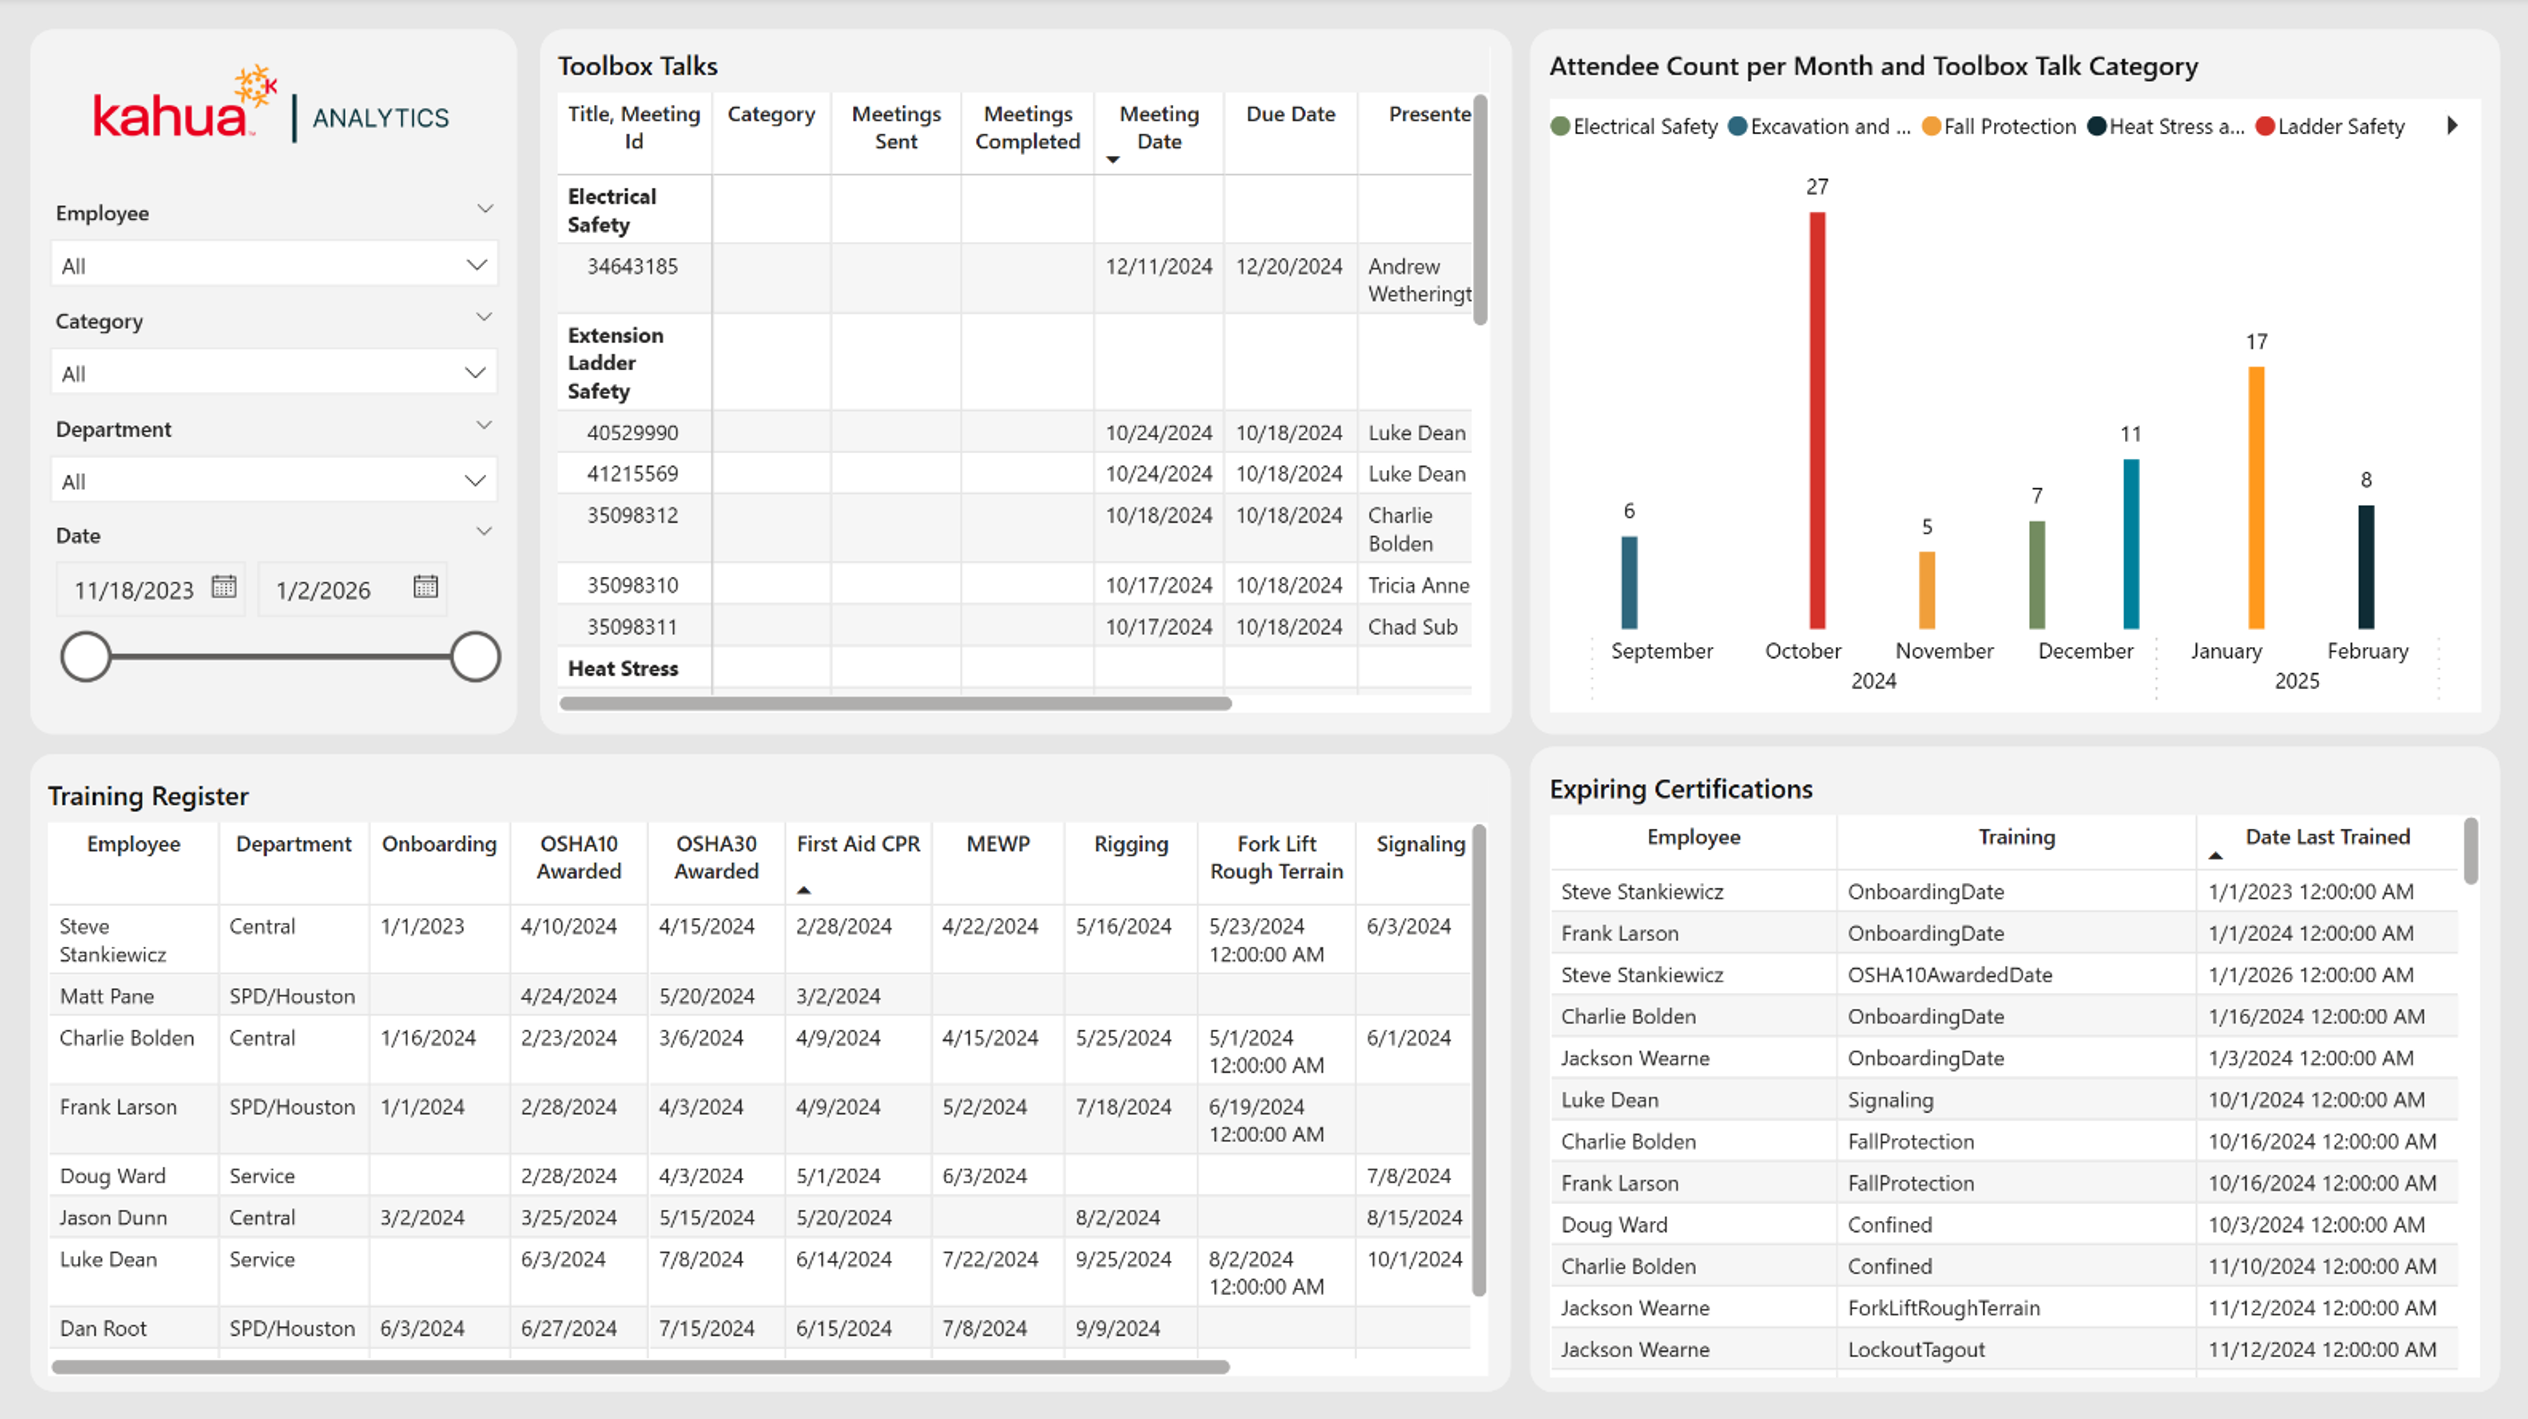
The Safety - Toolbox Talks & Training Register Dashboard displays toolbox talk activity, attendee counts, training records, and expiring certifications.
Description
This dashboard enables subcontractors to monitor safety communication and employee training compliance.
Problem
Training and safety meeting records can become difficult to manage when employees have different certification dates, due dates, and completed meetings.
Benefit
This dashboard helps subcontractors keep training and toolbox talk information visible. Teams can review who has completed required training, which certifications may expire, and how safety meeting attendance changes over time.
The following apps are necessary to utilize this dashboard:
-
Portfolio Manager
-
Safety Suite
-
Contacts
-
People
-
Out of the Box Dashboard Interface
Project Management Dashboards
These dashboards center around Document Management applications and are available at a project level. Rather than showing all records across a domain, they drill down to those associated with the project the dashboard has been filtered to focus on.
PM Summary
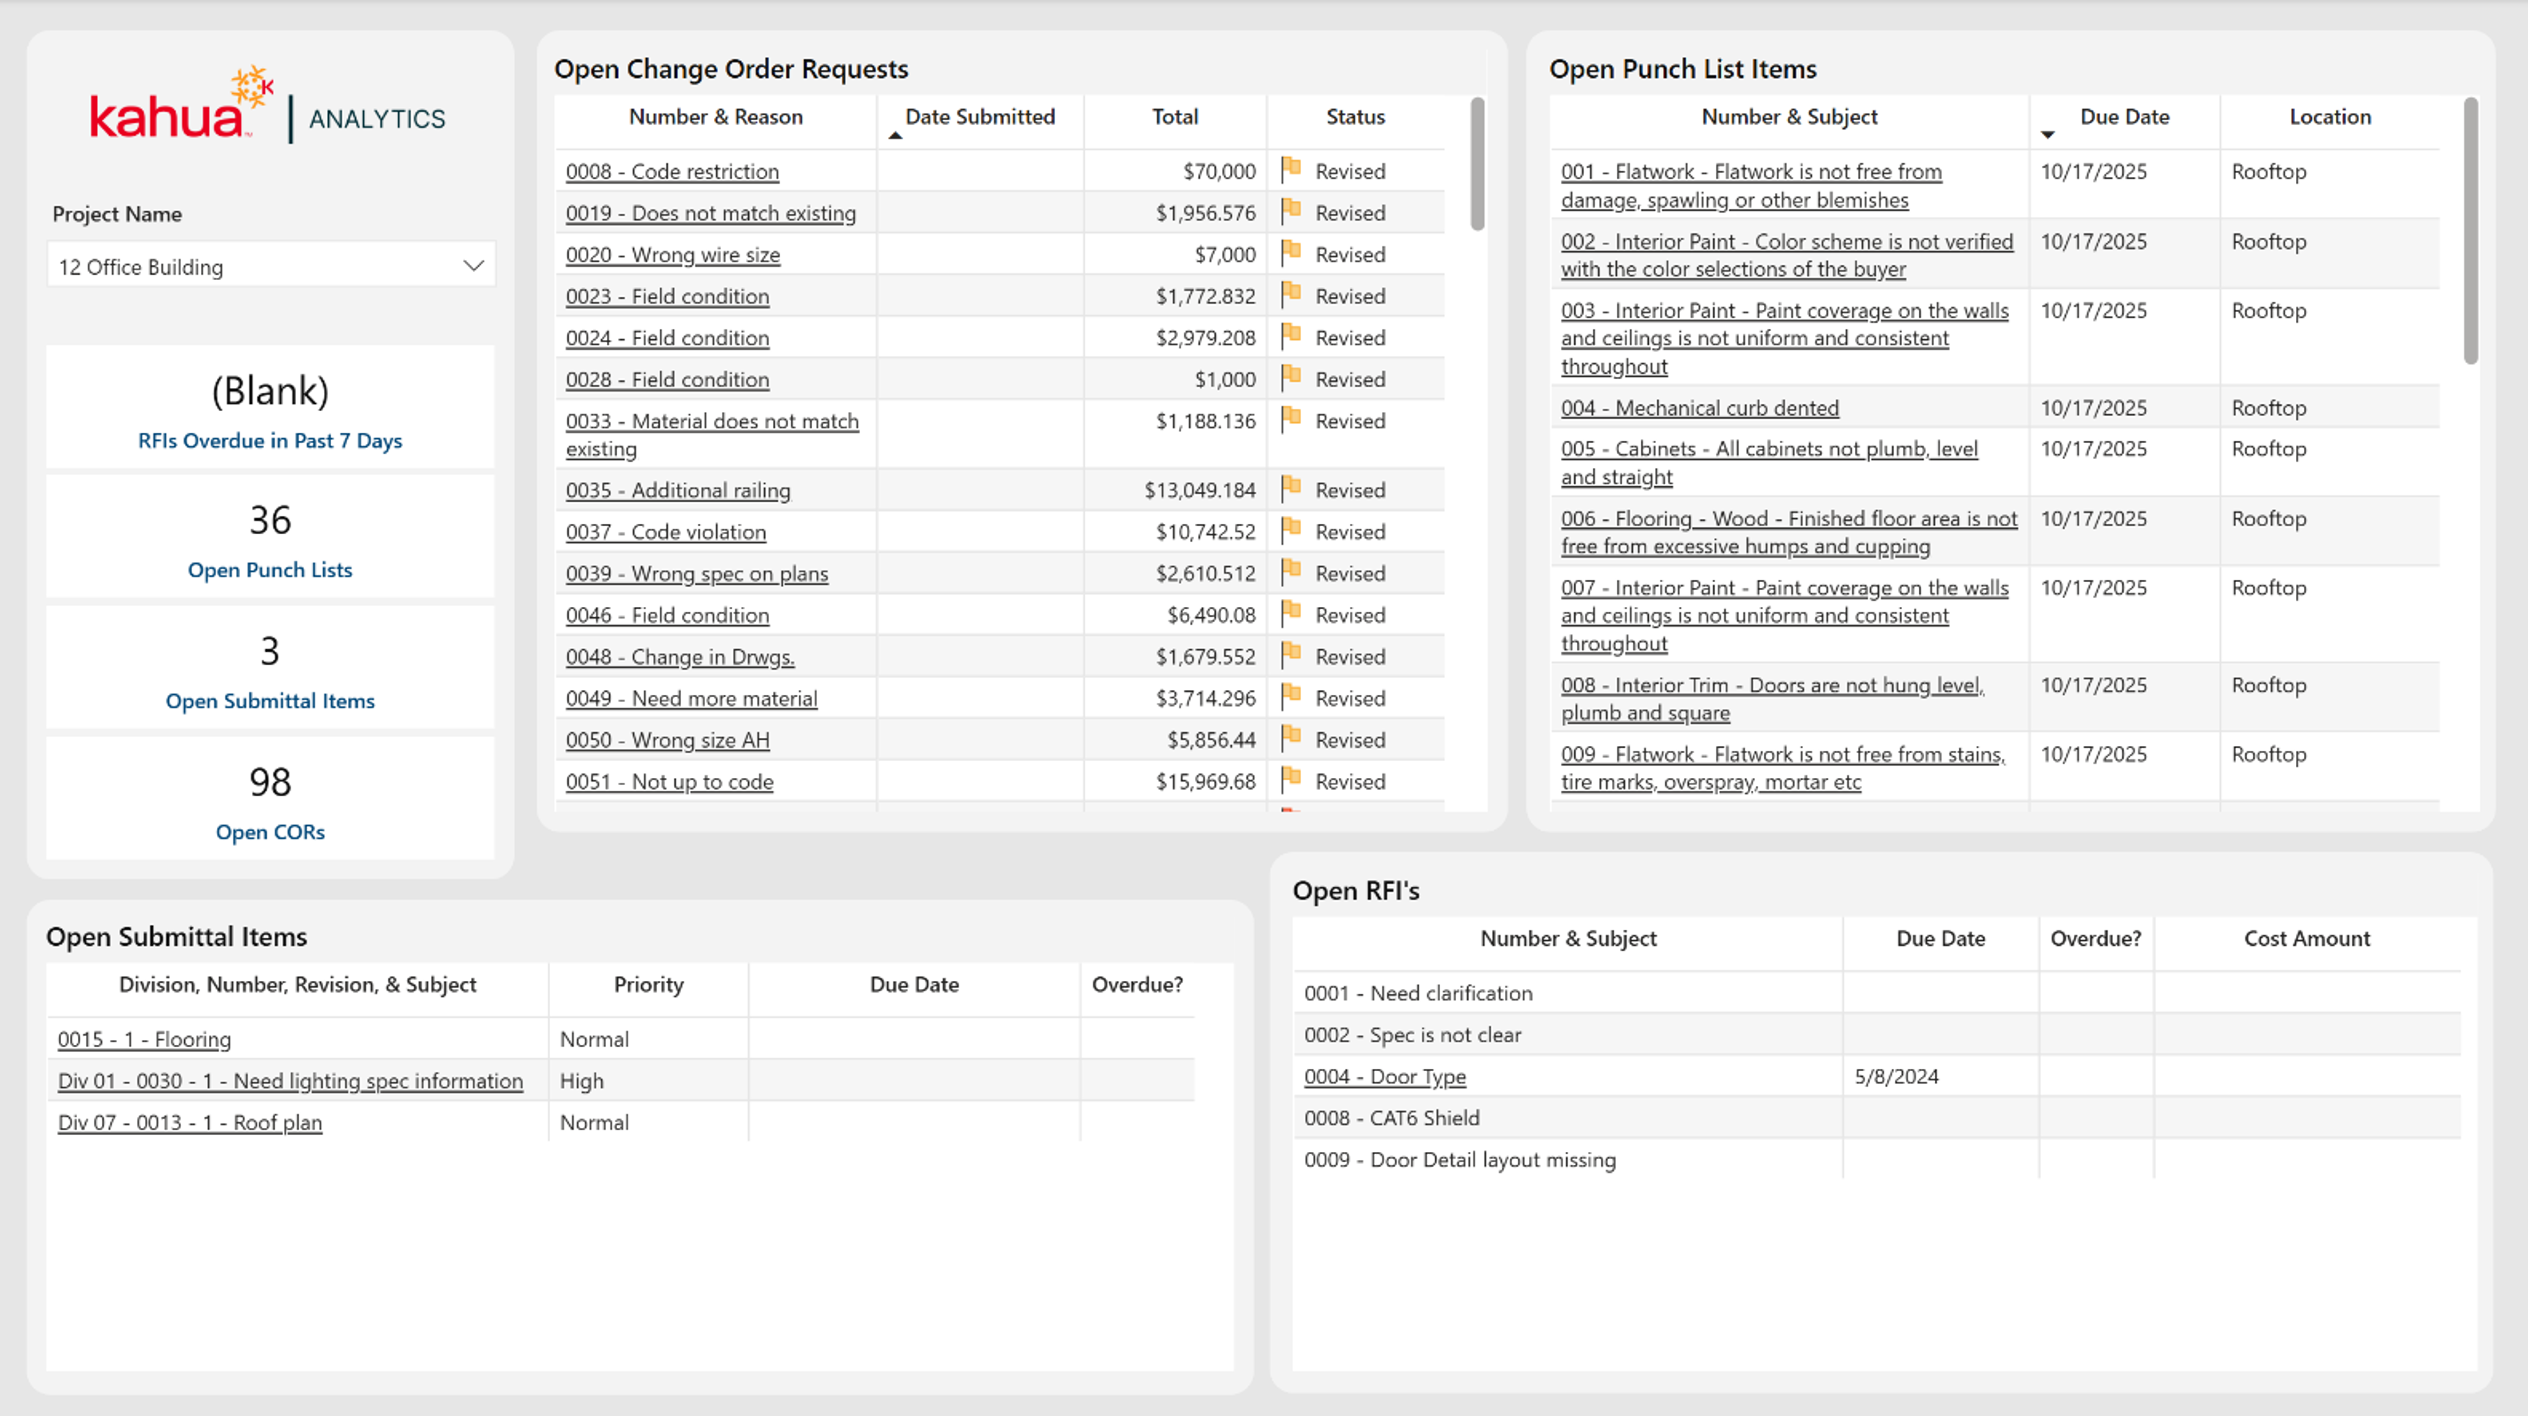
The Project Management (PM) Summary Dashboard serves as a landing page for the Project Management category of dashboards. It provides detailed overviews of open change order requests, punch list items, submittal items, and RFIs for each individual project. This helps subcontractors understand the state of the project's key records and identify action items quickly.
Description
PM Summary showcases detail table views for a handful of the applications included in the Project Management Dashboard Suite.
Problem
Change Order Requests, Punch Lists, Submittals, and RFIs are integral to any project. With so many spread across a project portfolio, it can be difficult to see specific records that require further action.
Benefit
This dashboard provides a single source of truth for project records, allowing subcontractors to pinpoint what records have been submitted and their statuses.
The following apps are necessary to utilize this dashboard:
-
Portfolio Manager
-
Change Orders Request
-
Punch Lists
-
Punch List Libraries
-
Submittal Items
-
RFIs
-
Locations
-
Contacts
-
People
-
Out of the Box Dashboard Interface
Change Order Requests
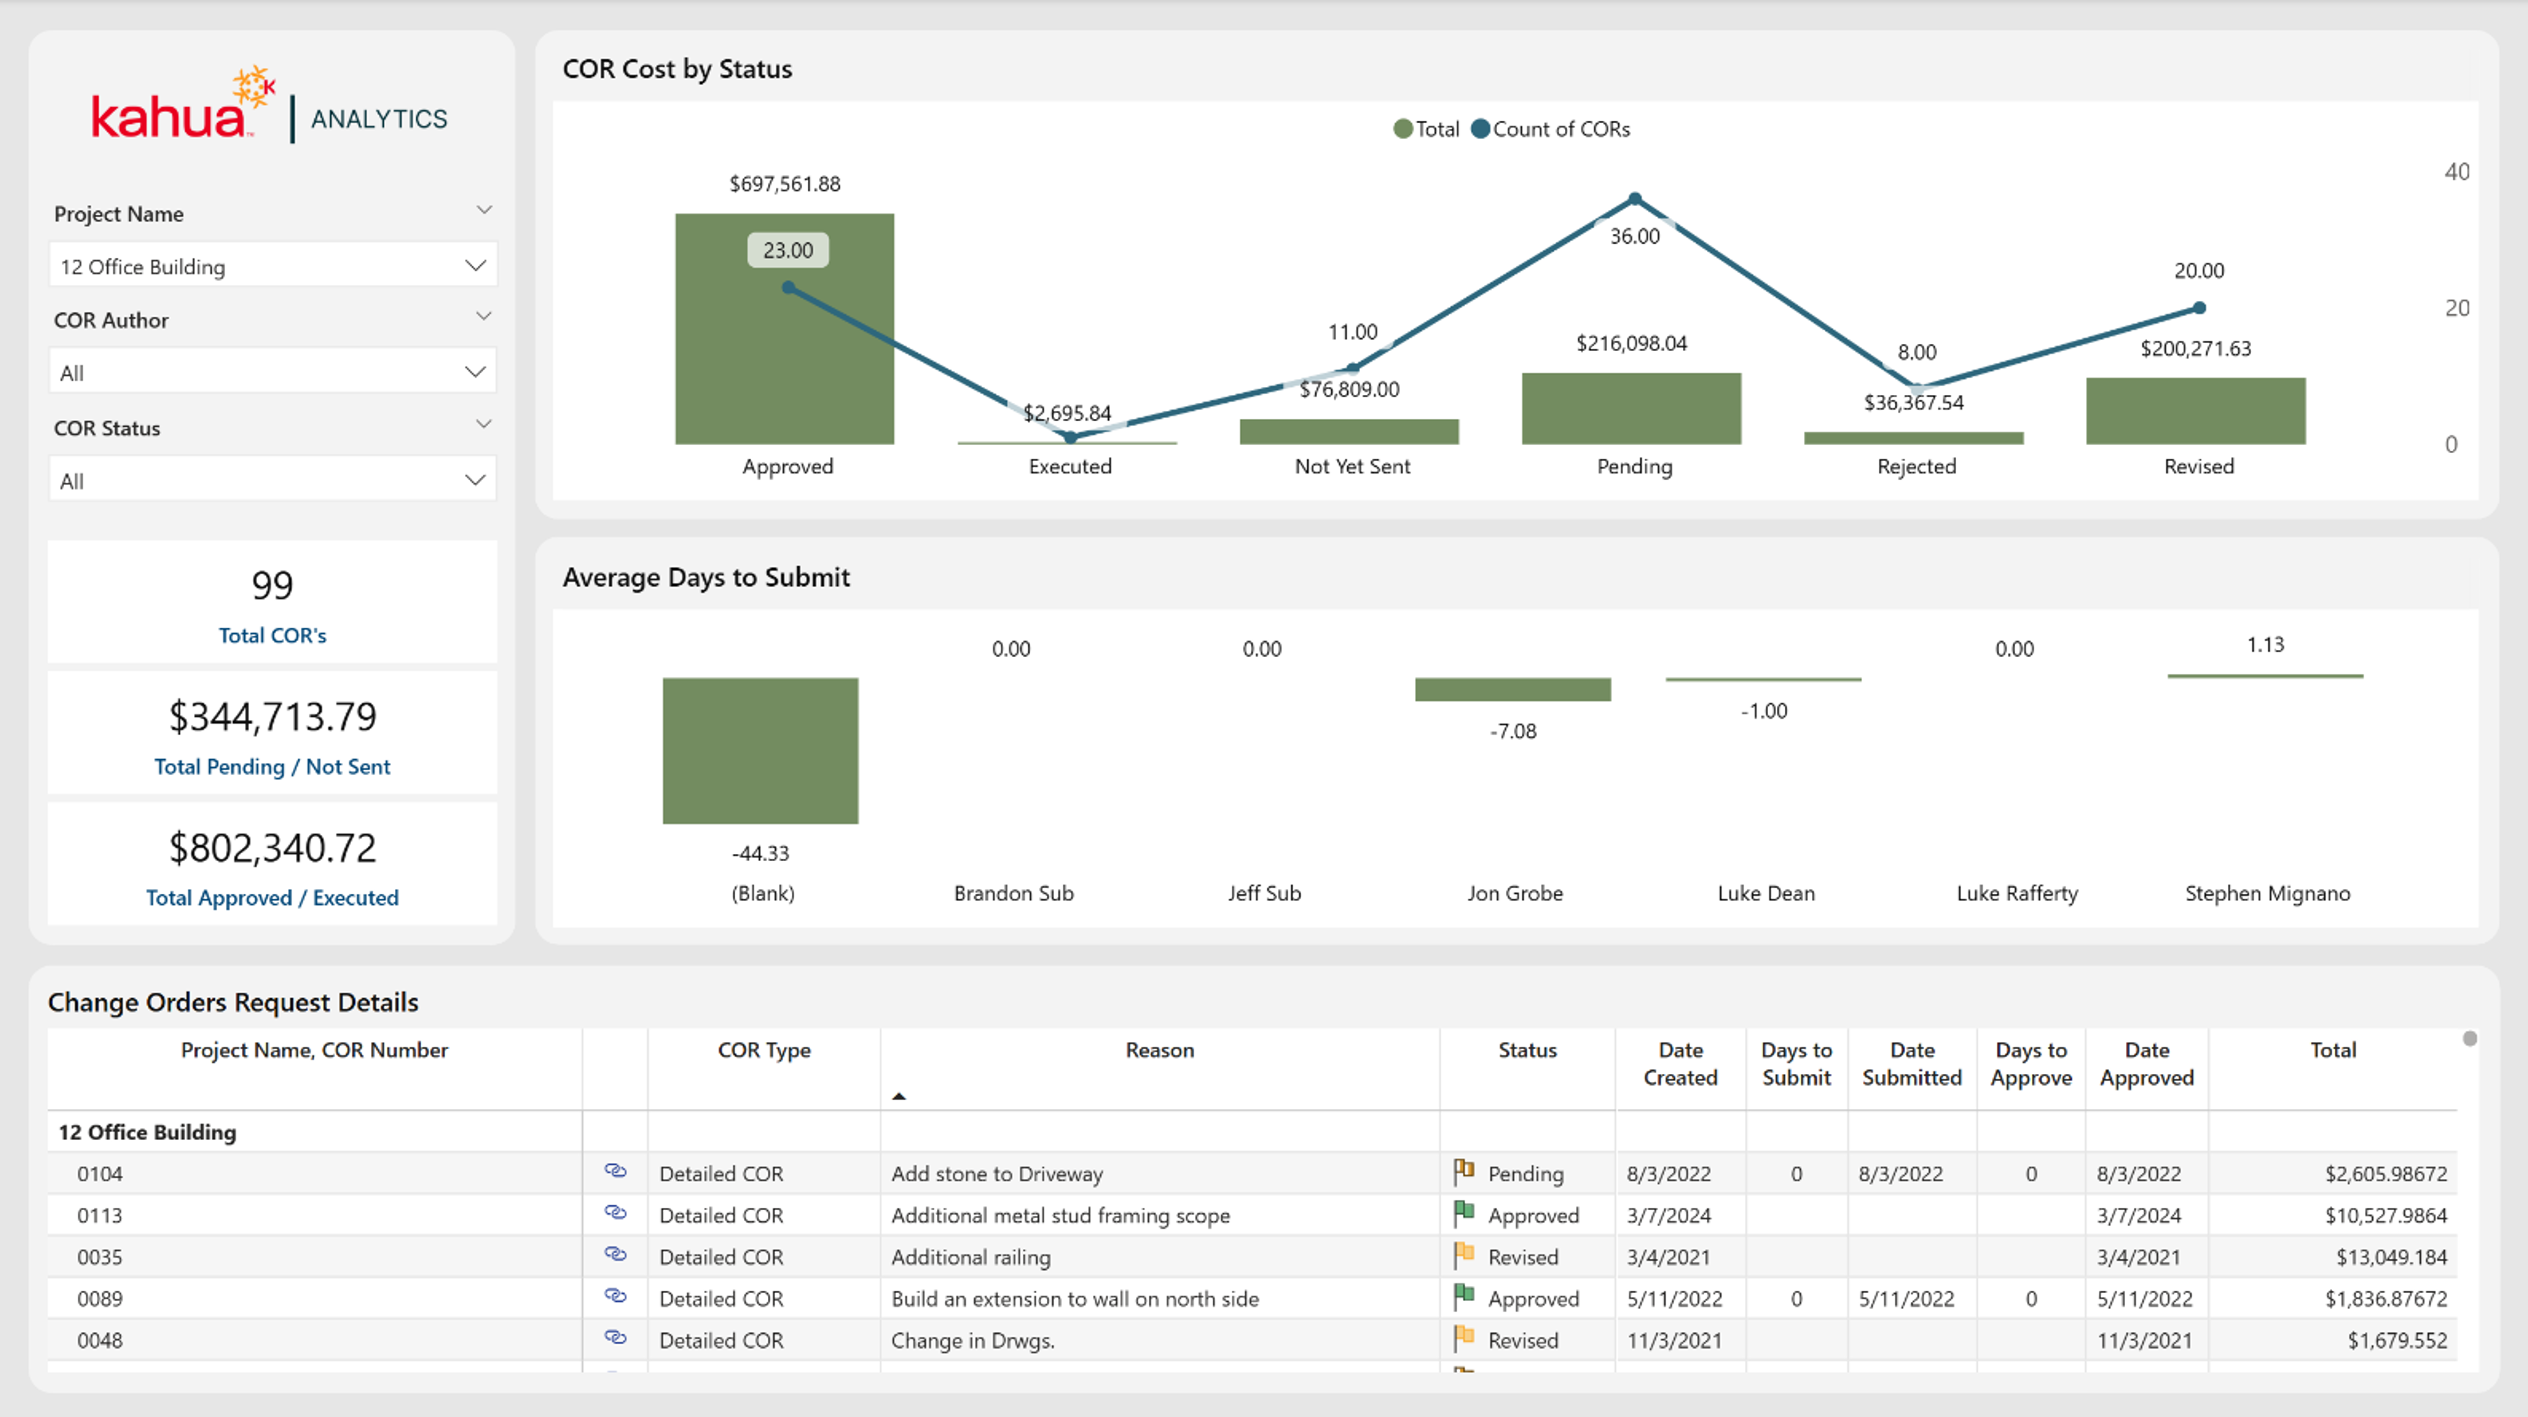
The Change Order Requests (COR) Dashboard displays COR activity by status, cost, author, and approval timeline. It helps subcontractors understand the volume and status of all CORs for a given project.
Description
With information on status, cost, and days to submit, this dashboard enables subcontractors to maintain awareness of important COR data.
Problem
CORs can have a large financial impact, but their status and timing can be hard to monitor when they are managed across several projects and authors.
Benefit
This dashboard shows the value and status of change order requests, helping teams know what to follow up on and when potential revenue changes may arise.
The following apps are necessary to utilize this dashboard:
-
Portfolio Manager
-
Change Orders Request
-
Contacts
-
People
-
Out of the Box Dashboard Interface
Submittals
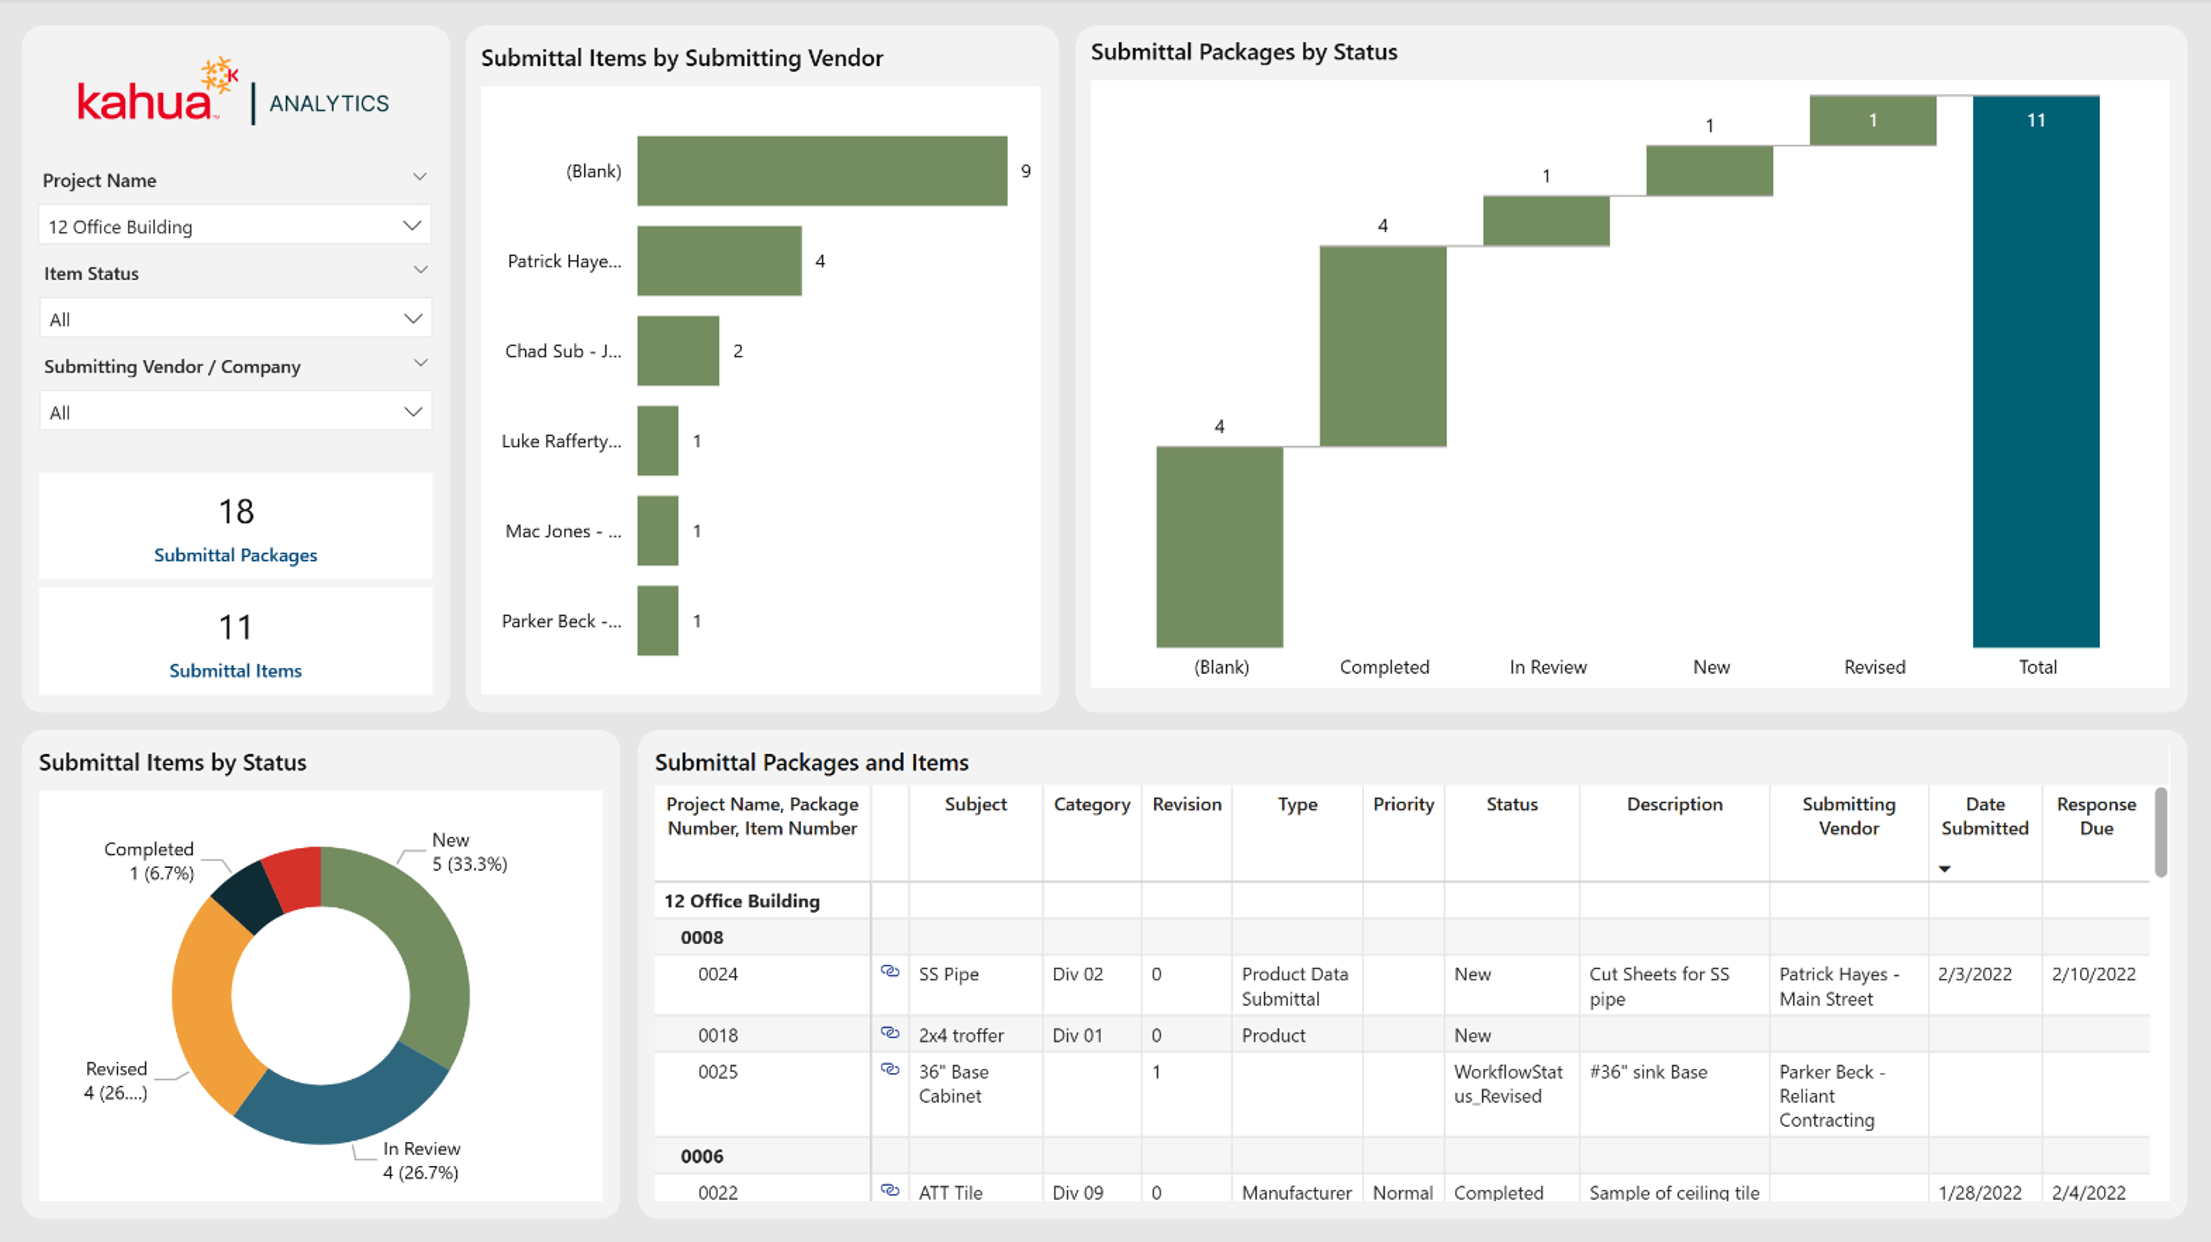
The Submittals Dashboard displays submittal package and item activity across status and submitting vendors. It helps subcontractors keep record of what they have submitted.
Description
The Submittals Dashboard includes views into the status of both submittal packages and items. This offers key insights into project compliance and progress.
Problem
Each project can have multiple submittals, which may lead subcontractors to struggle with keeping track of the records and their statuses.
Benefit
This dashboard gives subcontractors a clear view of their submittal pipeline, allowing them to identify items by status and understand what projects and packages they are associated with.
The following apps are necessary to utilize this dashboard:
-
Portfolio Manager
-
Submittal Items
-
Submittal Packages
-
Contacts
-
People
-
Out of the Box Dashboard Interface
RFIs
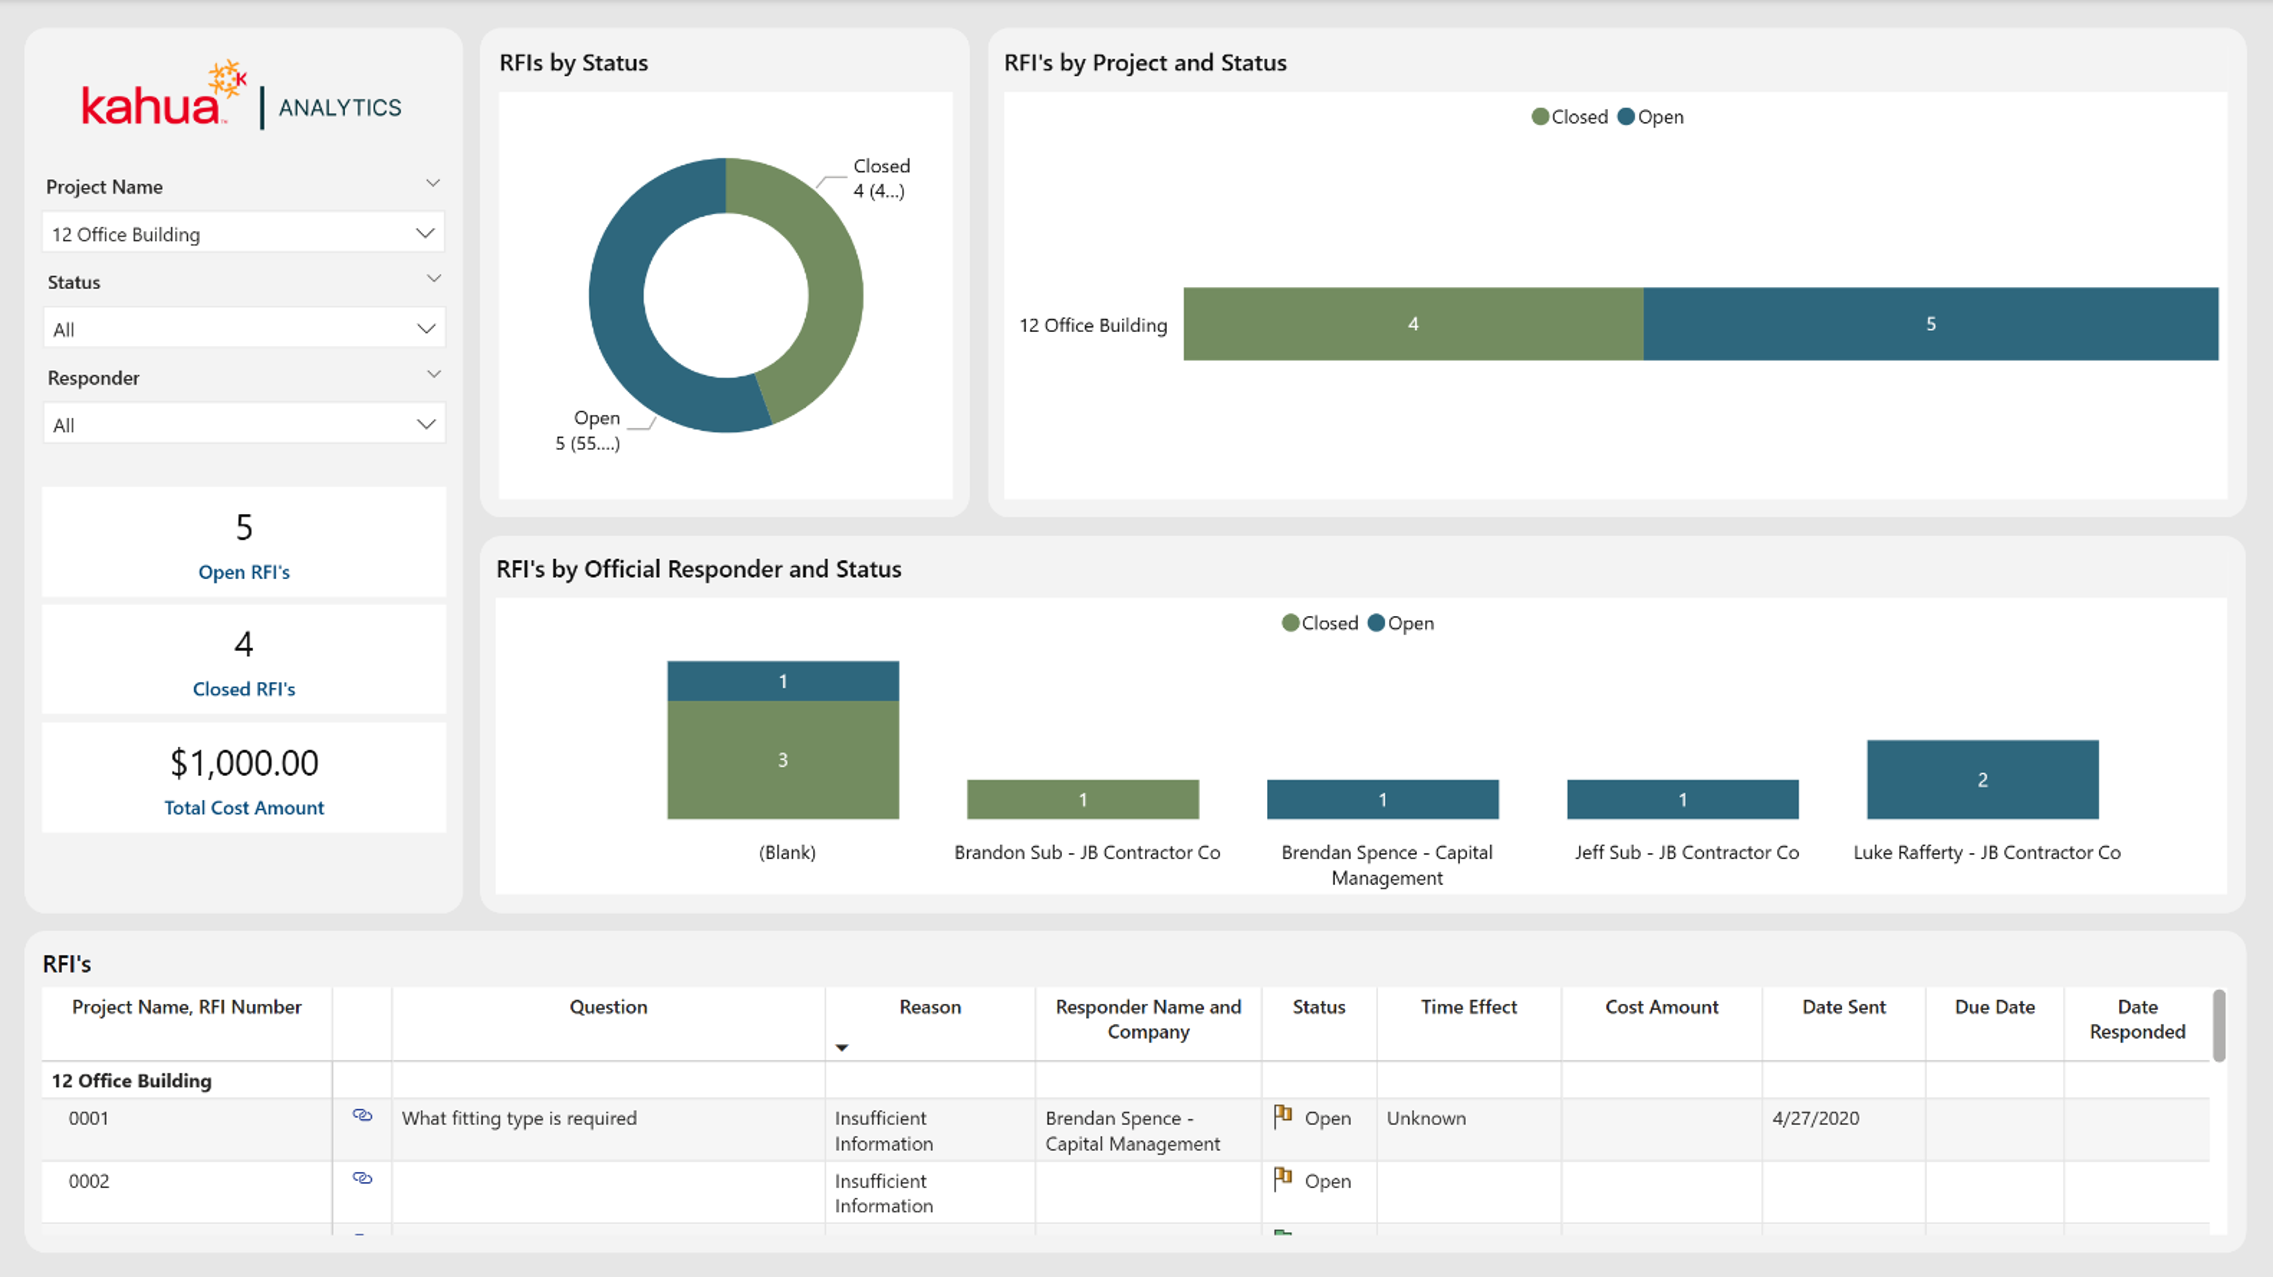
The RFIs (Requests for Information) Dashboard displays details for RFIs associated with a given project. Users can view RFI status, items, responder information, due dates, and project-level RFI counts.
Description
This dashboard serves as a single source of truth for RFI management.
Problem
With many incoming RFIs from many projects, it can be difficult to keep track of and answer all requests in a timely manner.
Benefit
By centralizing RFI information, this dashboard allows subcontractors to see which responders are associated with outstanding questions, maintaining open communication and reducing delays.
The following apps are necessary to utilize this dashboard:
-
Portfolio Manager
-
RFIs
-
Contacts
-
Companies
-
People
-
Out of the Box Dashboard Interface
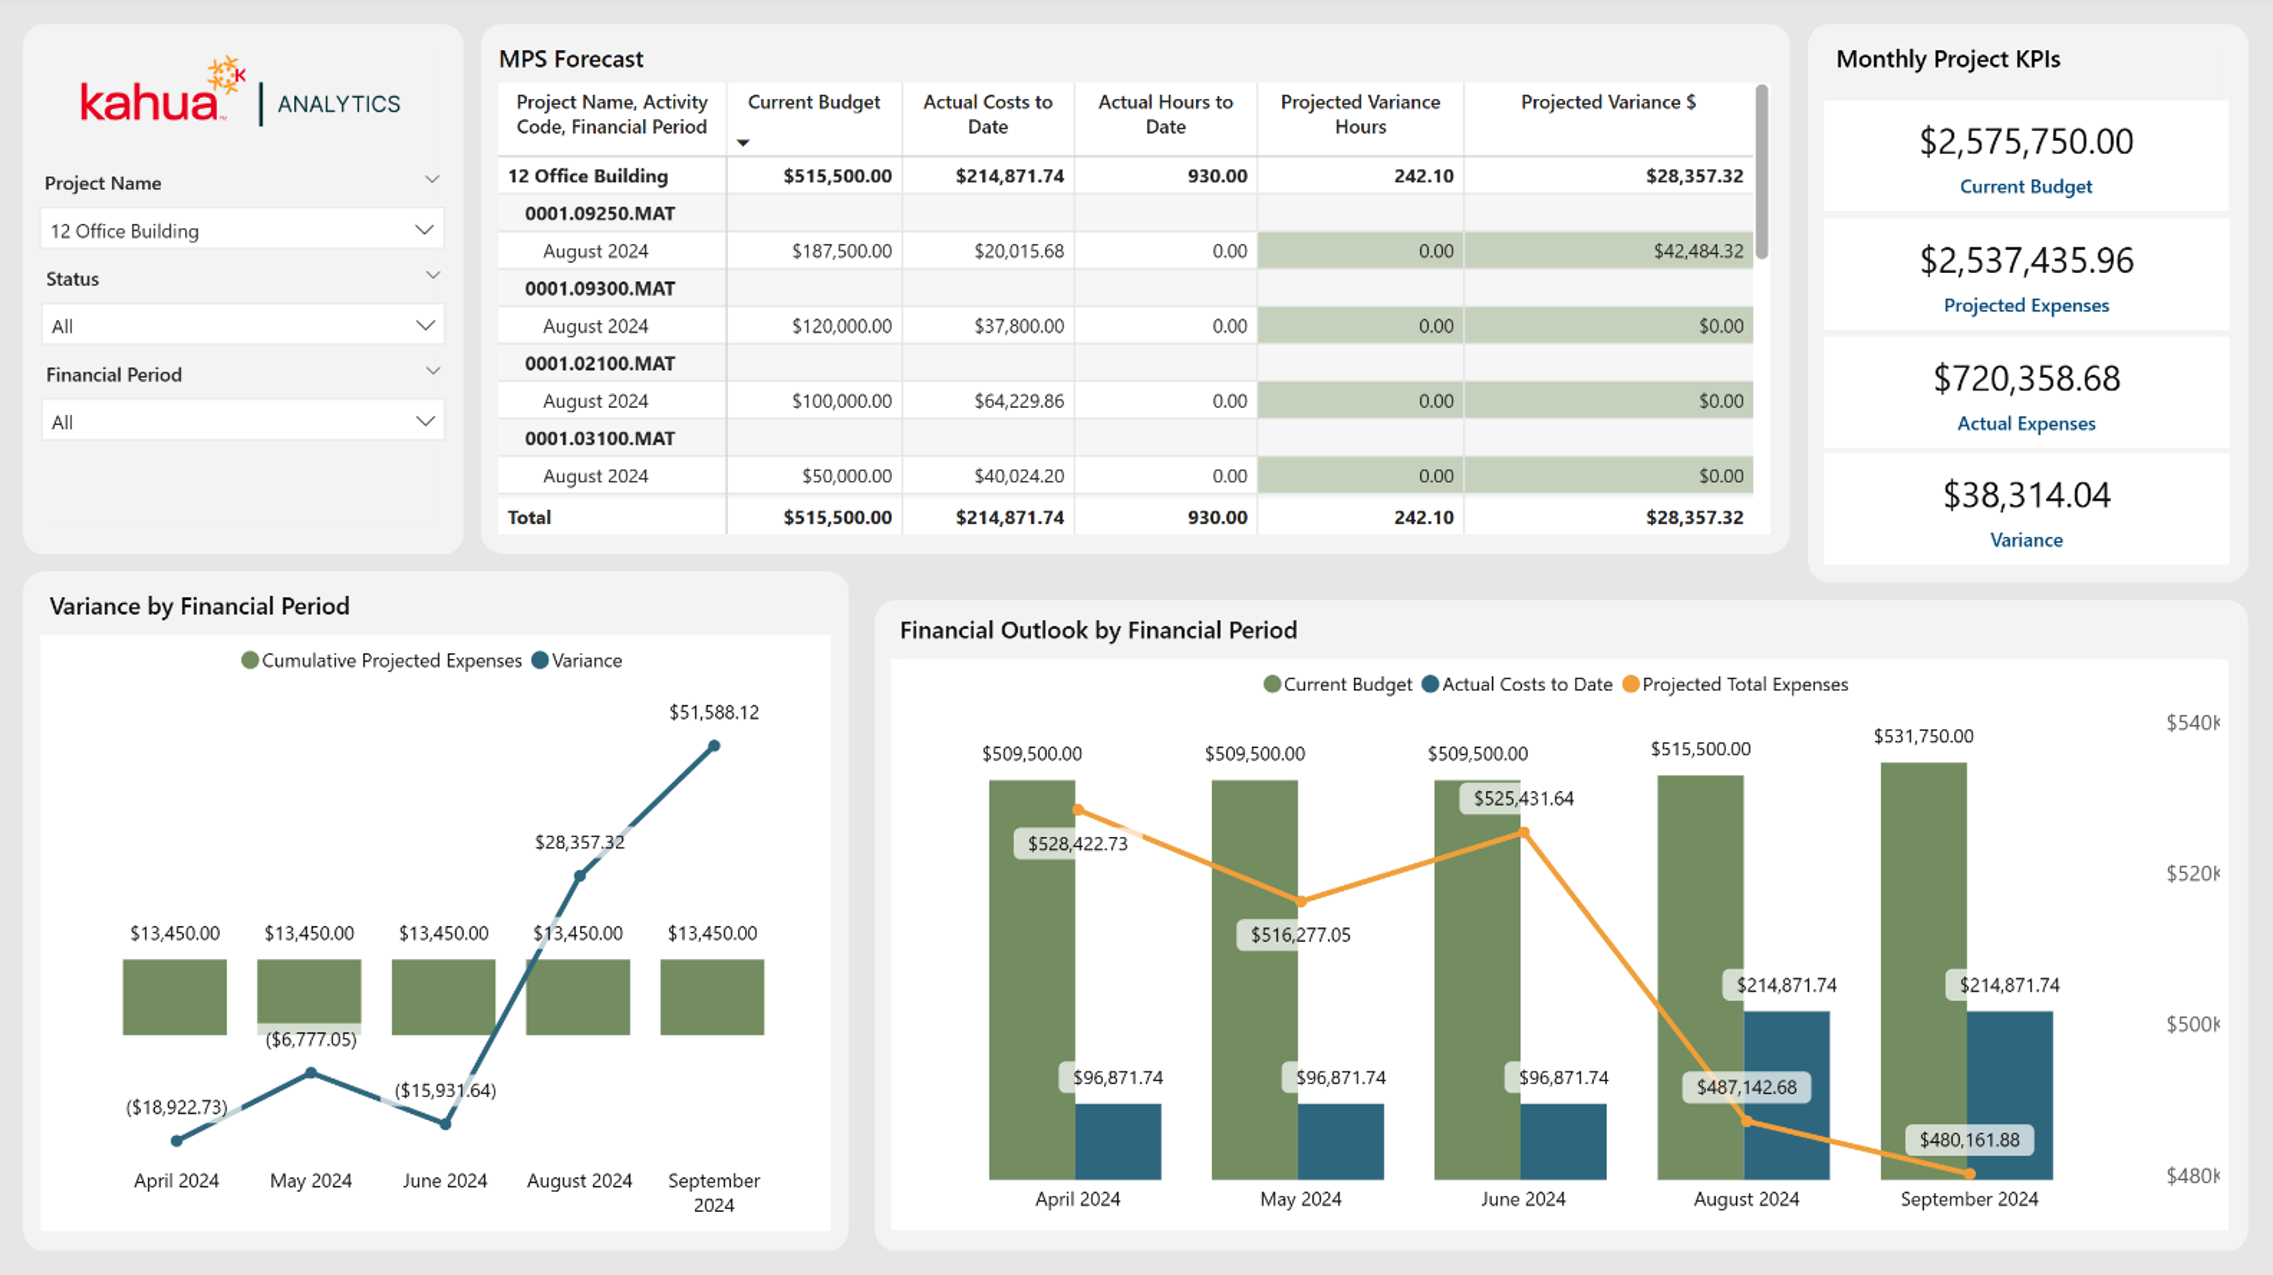
Monthly Project Status
The Monthly Project Status Dashboard offers a financial snapshot of each project by month. It highlights the difference between the current budget and projected expenses, providing insights into budget adherence and financial performance.
Description
This dashboard focuses on the financials across projects, informing subcontractors of where they are monetarily and if budget variance is likely.
Problem
It can be challenging to track financial information across multiple different projects, making it difficult to project possible variance and expenses.
Benefit
This dashboard offers subcontractors a quick way to know where they stand with each project and financial period. It displays information on the current budget and projections based on historical data, with the ability to drill down for project-level insights or aggregate for monthly amounts and forecasts at the portfolio level.
The following apps are necessary to utilize this dashboard:
-
Portfolio Manager
-
Monthly Project Status
Out of the Box Dashboard Interface
Service Quotes
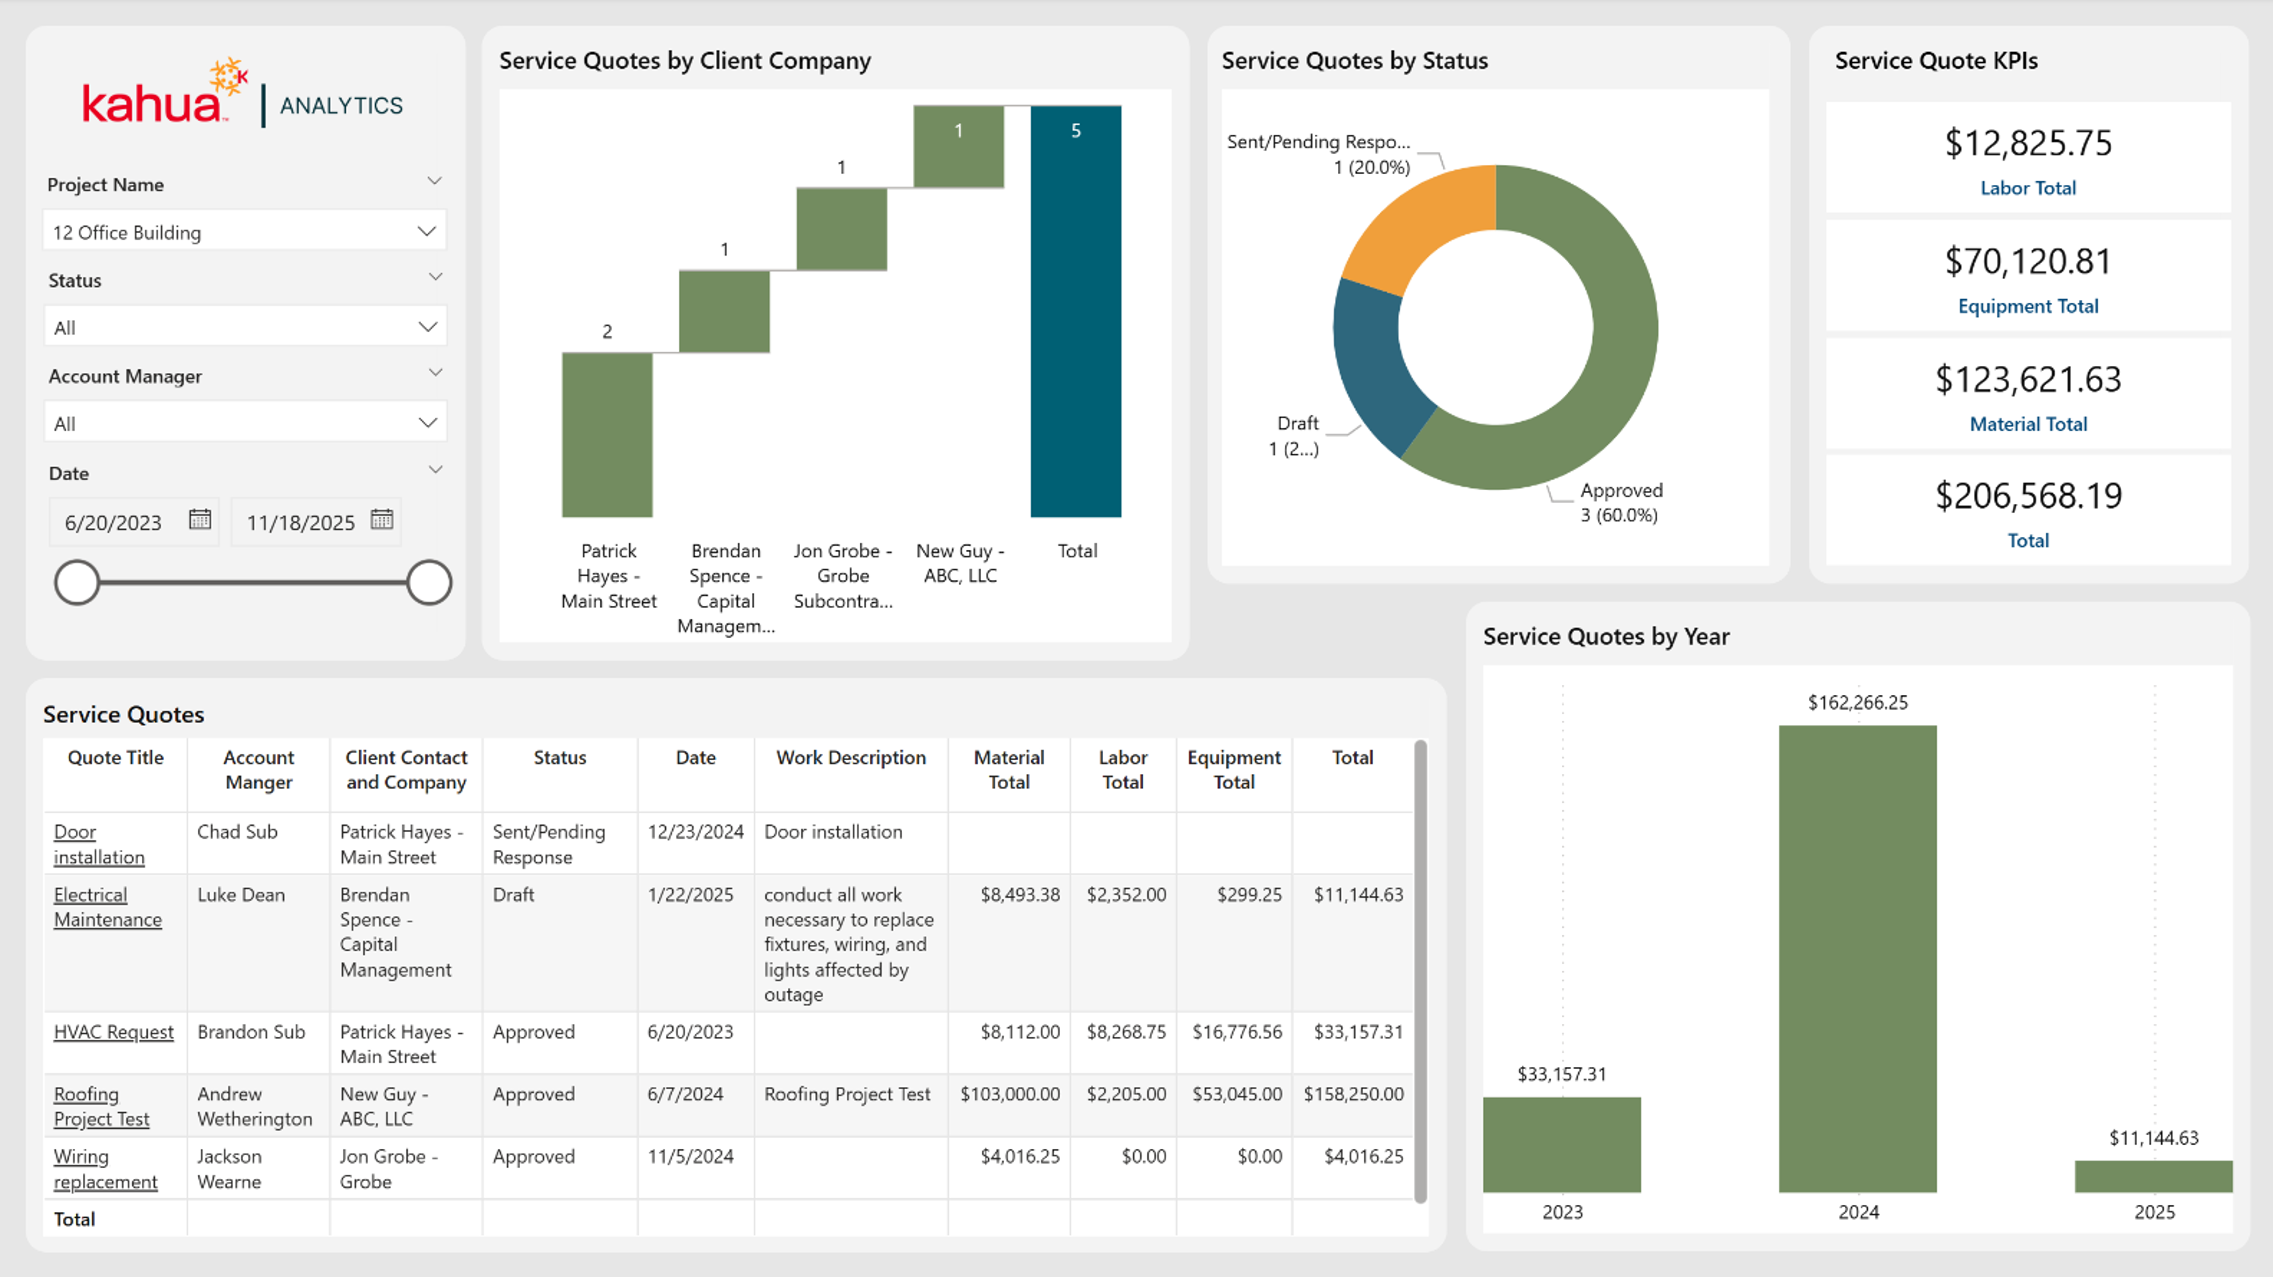
The Service Quotes Dashboard displays service quote activity across client companies, statuses, years, and quote details. It provides visibility into labor, equipment, and material amounts so subcontractors can understand the costs associated with their service work.
Description
This dashboard provides a view into integral details related to service quotes, such as client company, status, and cost.
Problem
Service work can create many smaller quotes that are easy to lose track of when they are spread across different account managers, clients, and statuses.
Benefit
With the ability to quickly see the status and value of service quotes, subcontractors can follow up on pending responses and monitor cost information.
The following apps are necessary to utilize this dashboard:
-
Portfolio Manager
-
Service Quotes
-
Contacts
-
Companies
-
People
-
Out of the Box Dashboard Interface
Daily Work Reports
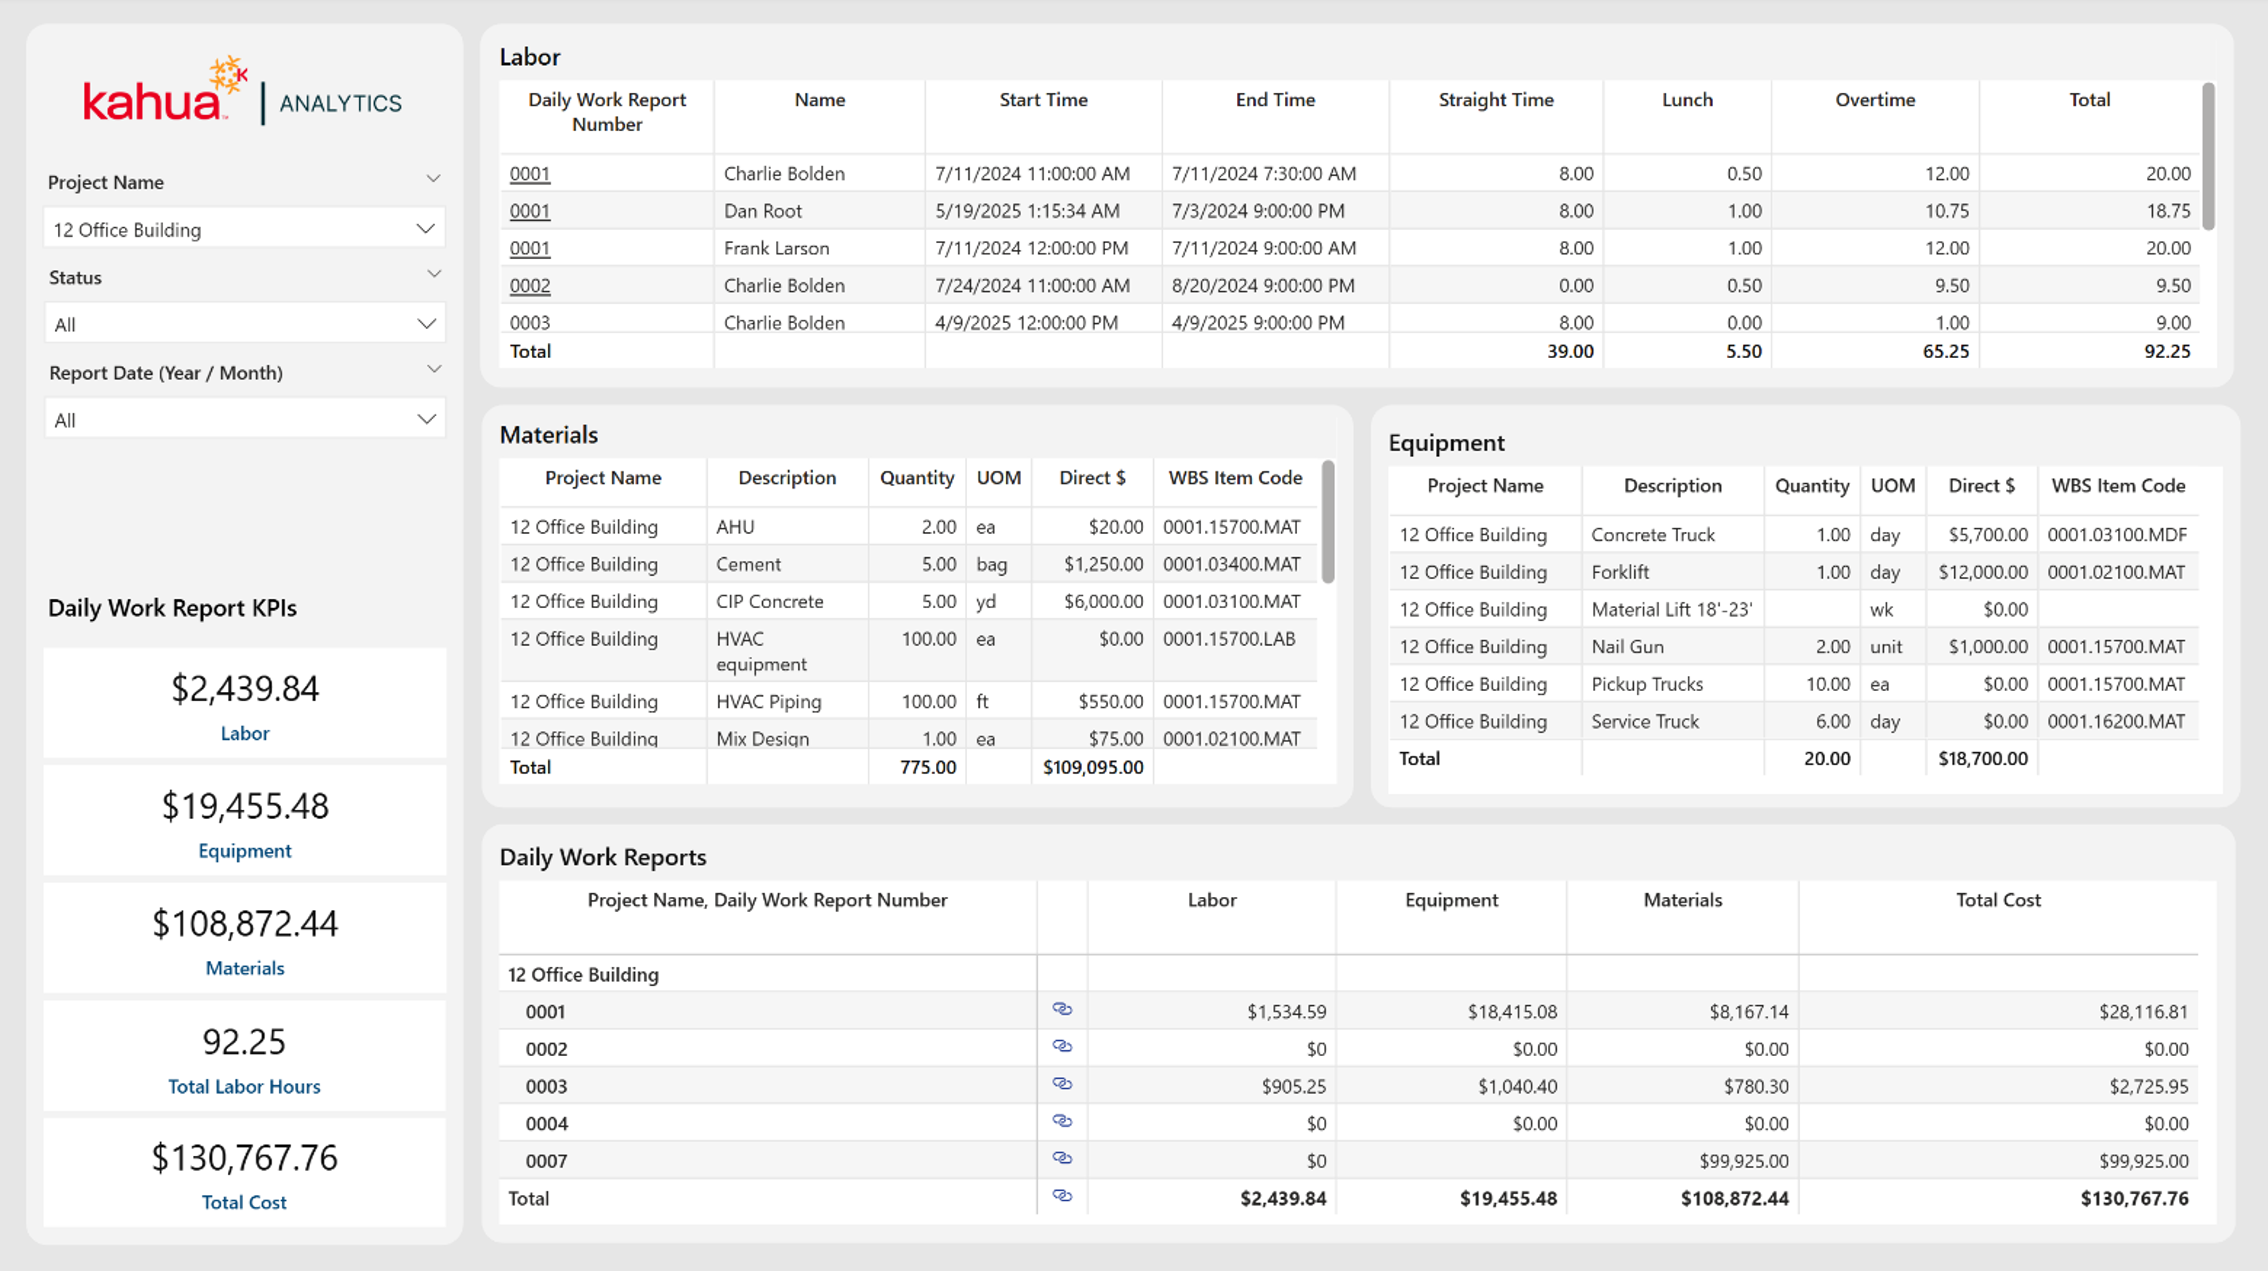
The Daily Work Reports Dashboard brings together the information on labor, material, and equipment captured through daily reporting. With the hours, quantities, direct costs, and total costs, it gives subcontractors a view into the operational efficiency of each project.
Description
Daily Work Reports acts as a centralized location for the data housed in the Daily Work Reports application.
Problem
Subcontractors rely on daily work reports to understand what occurred in the field on a given day. However, the details can be difficult to review when stored in separate records.
Benefit
This dashboard gives subcontractors a consolidated view of all field activity and the associated costs, helping them identify high-cost materials or equipment and better connect field reporting to project financials.
The following apps are necessary to utilize this dashboard:
-
Portfolio Manager
-
Daily Work Reports
-
Work Breakdown
-
Expense Suite
-
Funding Suite
-
Contacts
-
People
-
Out of the Box Dashboard Interface
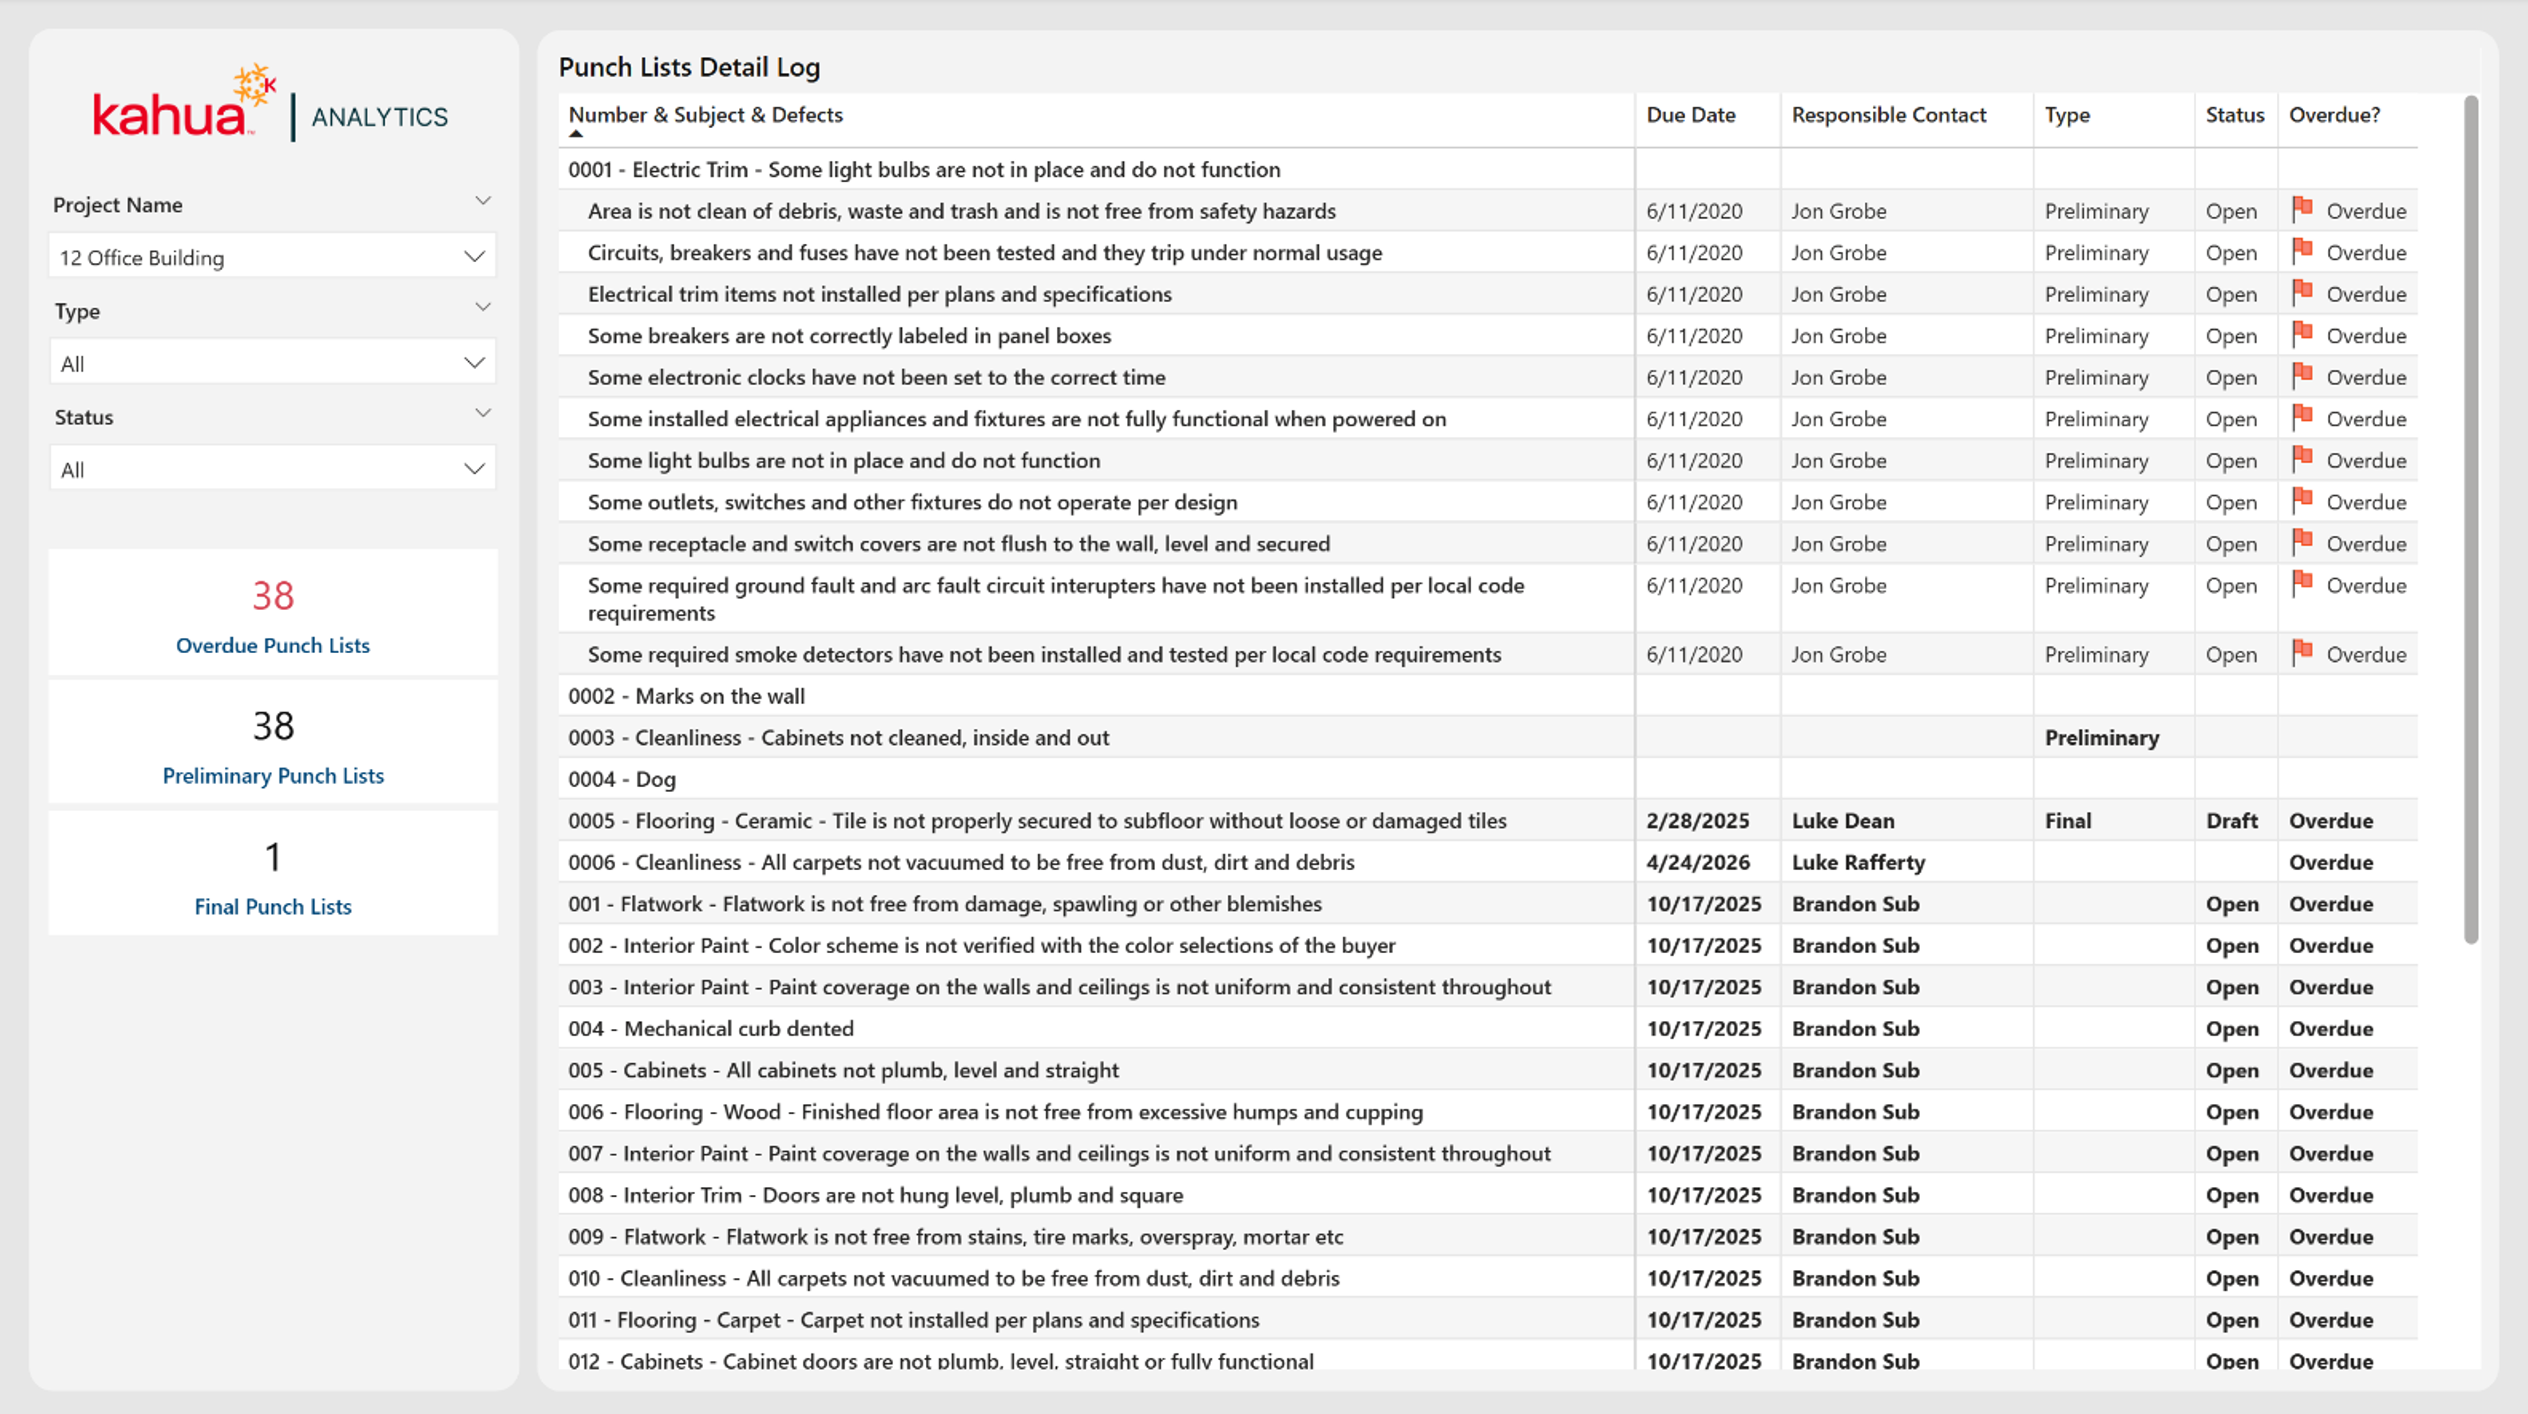
Punch Lists
The Punch Lists Dashboard displays a detailed log of the punch list item, due date, type, status, and responsible contact. It improves clarity into what issues must be addressed before the project can reach final completion.
Description
This dashboard serves as a source of truth for punch lists across each contracted project.
Problem
Punch Lists are vital for taking note of and addressing the issues remaining in a project. Because subcontractors work on a variety of projects at once, it can be difficult to keep track of what is left to do for each one.
Benefit
With this dashboard, subcontractors can know what needs to be done to push a project to final completion with insights into which punch lists require immediate attention, who is responsible for them, and what project they are connected to.
The following apps are necessary to utilize this dashboard:
-
Portfolio Manager
-
Punch Lists
-
Punch List Libraries
-
Contacts
-
People
-
Out of the Box Dashboard Interface