Using Kahua Analytics
Kahua Analytics functions as a two-way integration between Kahua and Power BI Report Server. It aggregates data from within the Kahua platform, giving you visibility into project health and status, from the portfolio level down to more granular detail.
Note If you are interested in Kahua Analytics and it is not currently available in your domain, please reach out to Support or your account representative for more information.
Key elements to know about this feature include the following:
-
Kahua Analytics dashboards source data from Kahua applications, such as projects, RFIs, and contracts, as well as Kahua integrations. Data cannot be pulled from external sources.
-
Each report has its own data model, refresh schedule, and permissions. Depending on configuration, users can view data from different partitions.
-
A report is an overall Analytics file. A dashboard is an individual page or tab within that report. A visual is an individual chart, table, matrix, KPI list, or other element on a dashboard.
-
Links to Kahua app records can be embedded within Kahua Analytics. Selecting one of these links opens the associated app record in a new window, making it easier to navigate to and reconcile the underlying data.
-
Kahua Analytics permissions are controlled through Kahua using the Groups and Configuration applications.
Note The term dashboard in this article refers to a page within a Kahua Analytics report. This is separate from the Dashboards application in Kahua.
How to . . .
 Access the Analytics app and select a report
The Kahua Analytics app is accessed in the same manner as any other Kahua app. From the Apps menu, select All Apps > Analytics.
When the app opens, the reports available for selection in your domain appear in the upper left-hand corner. Across the bottom of the page are the various dashboards that are part of the report. Each dashboard contains representations of data called visuals. Visuals are configured to represent data in a number of ways, such as a table, chart, list of KPIs, map, etc.
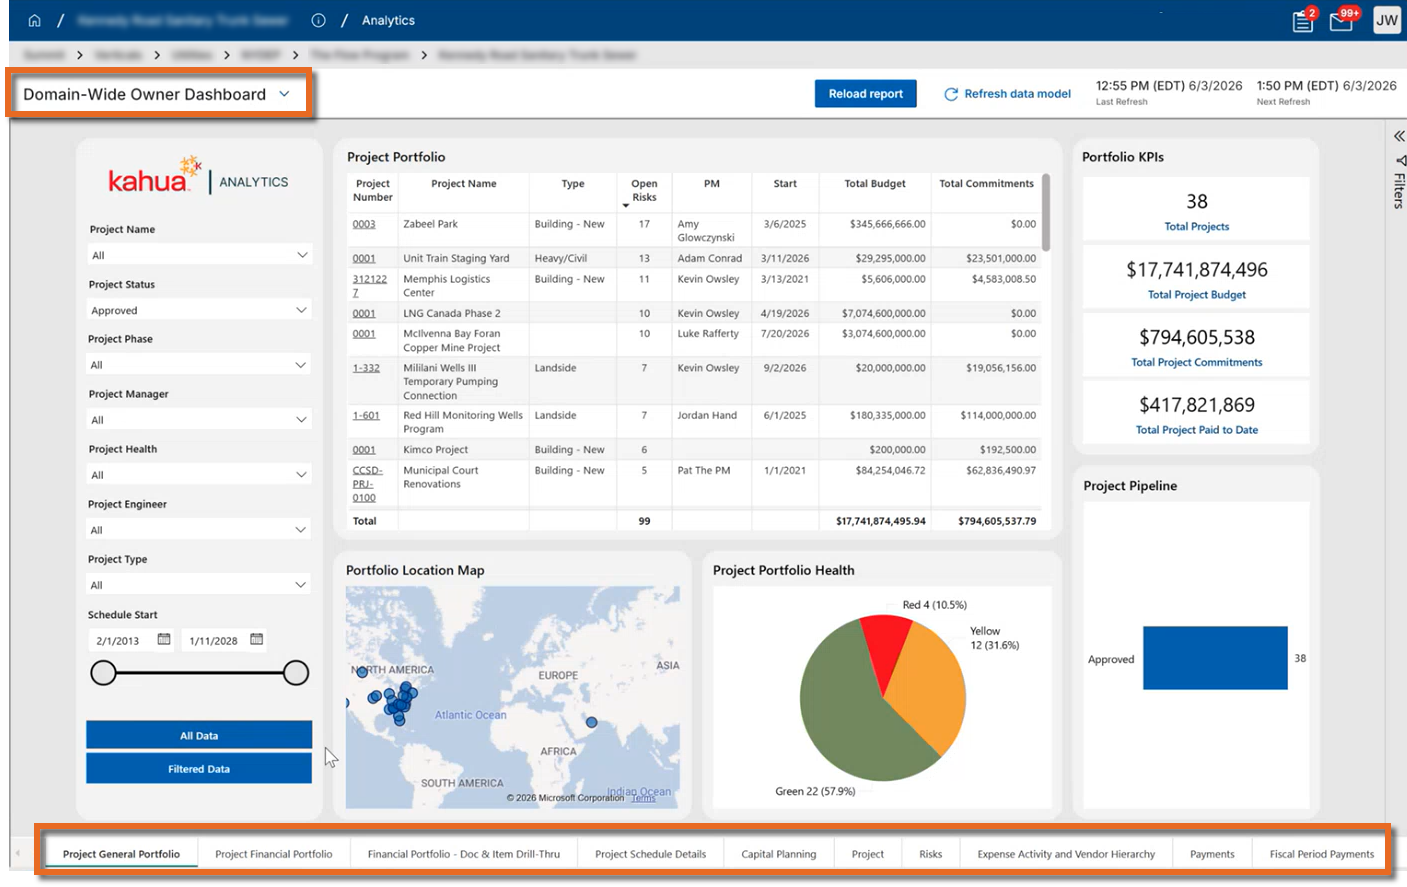
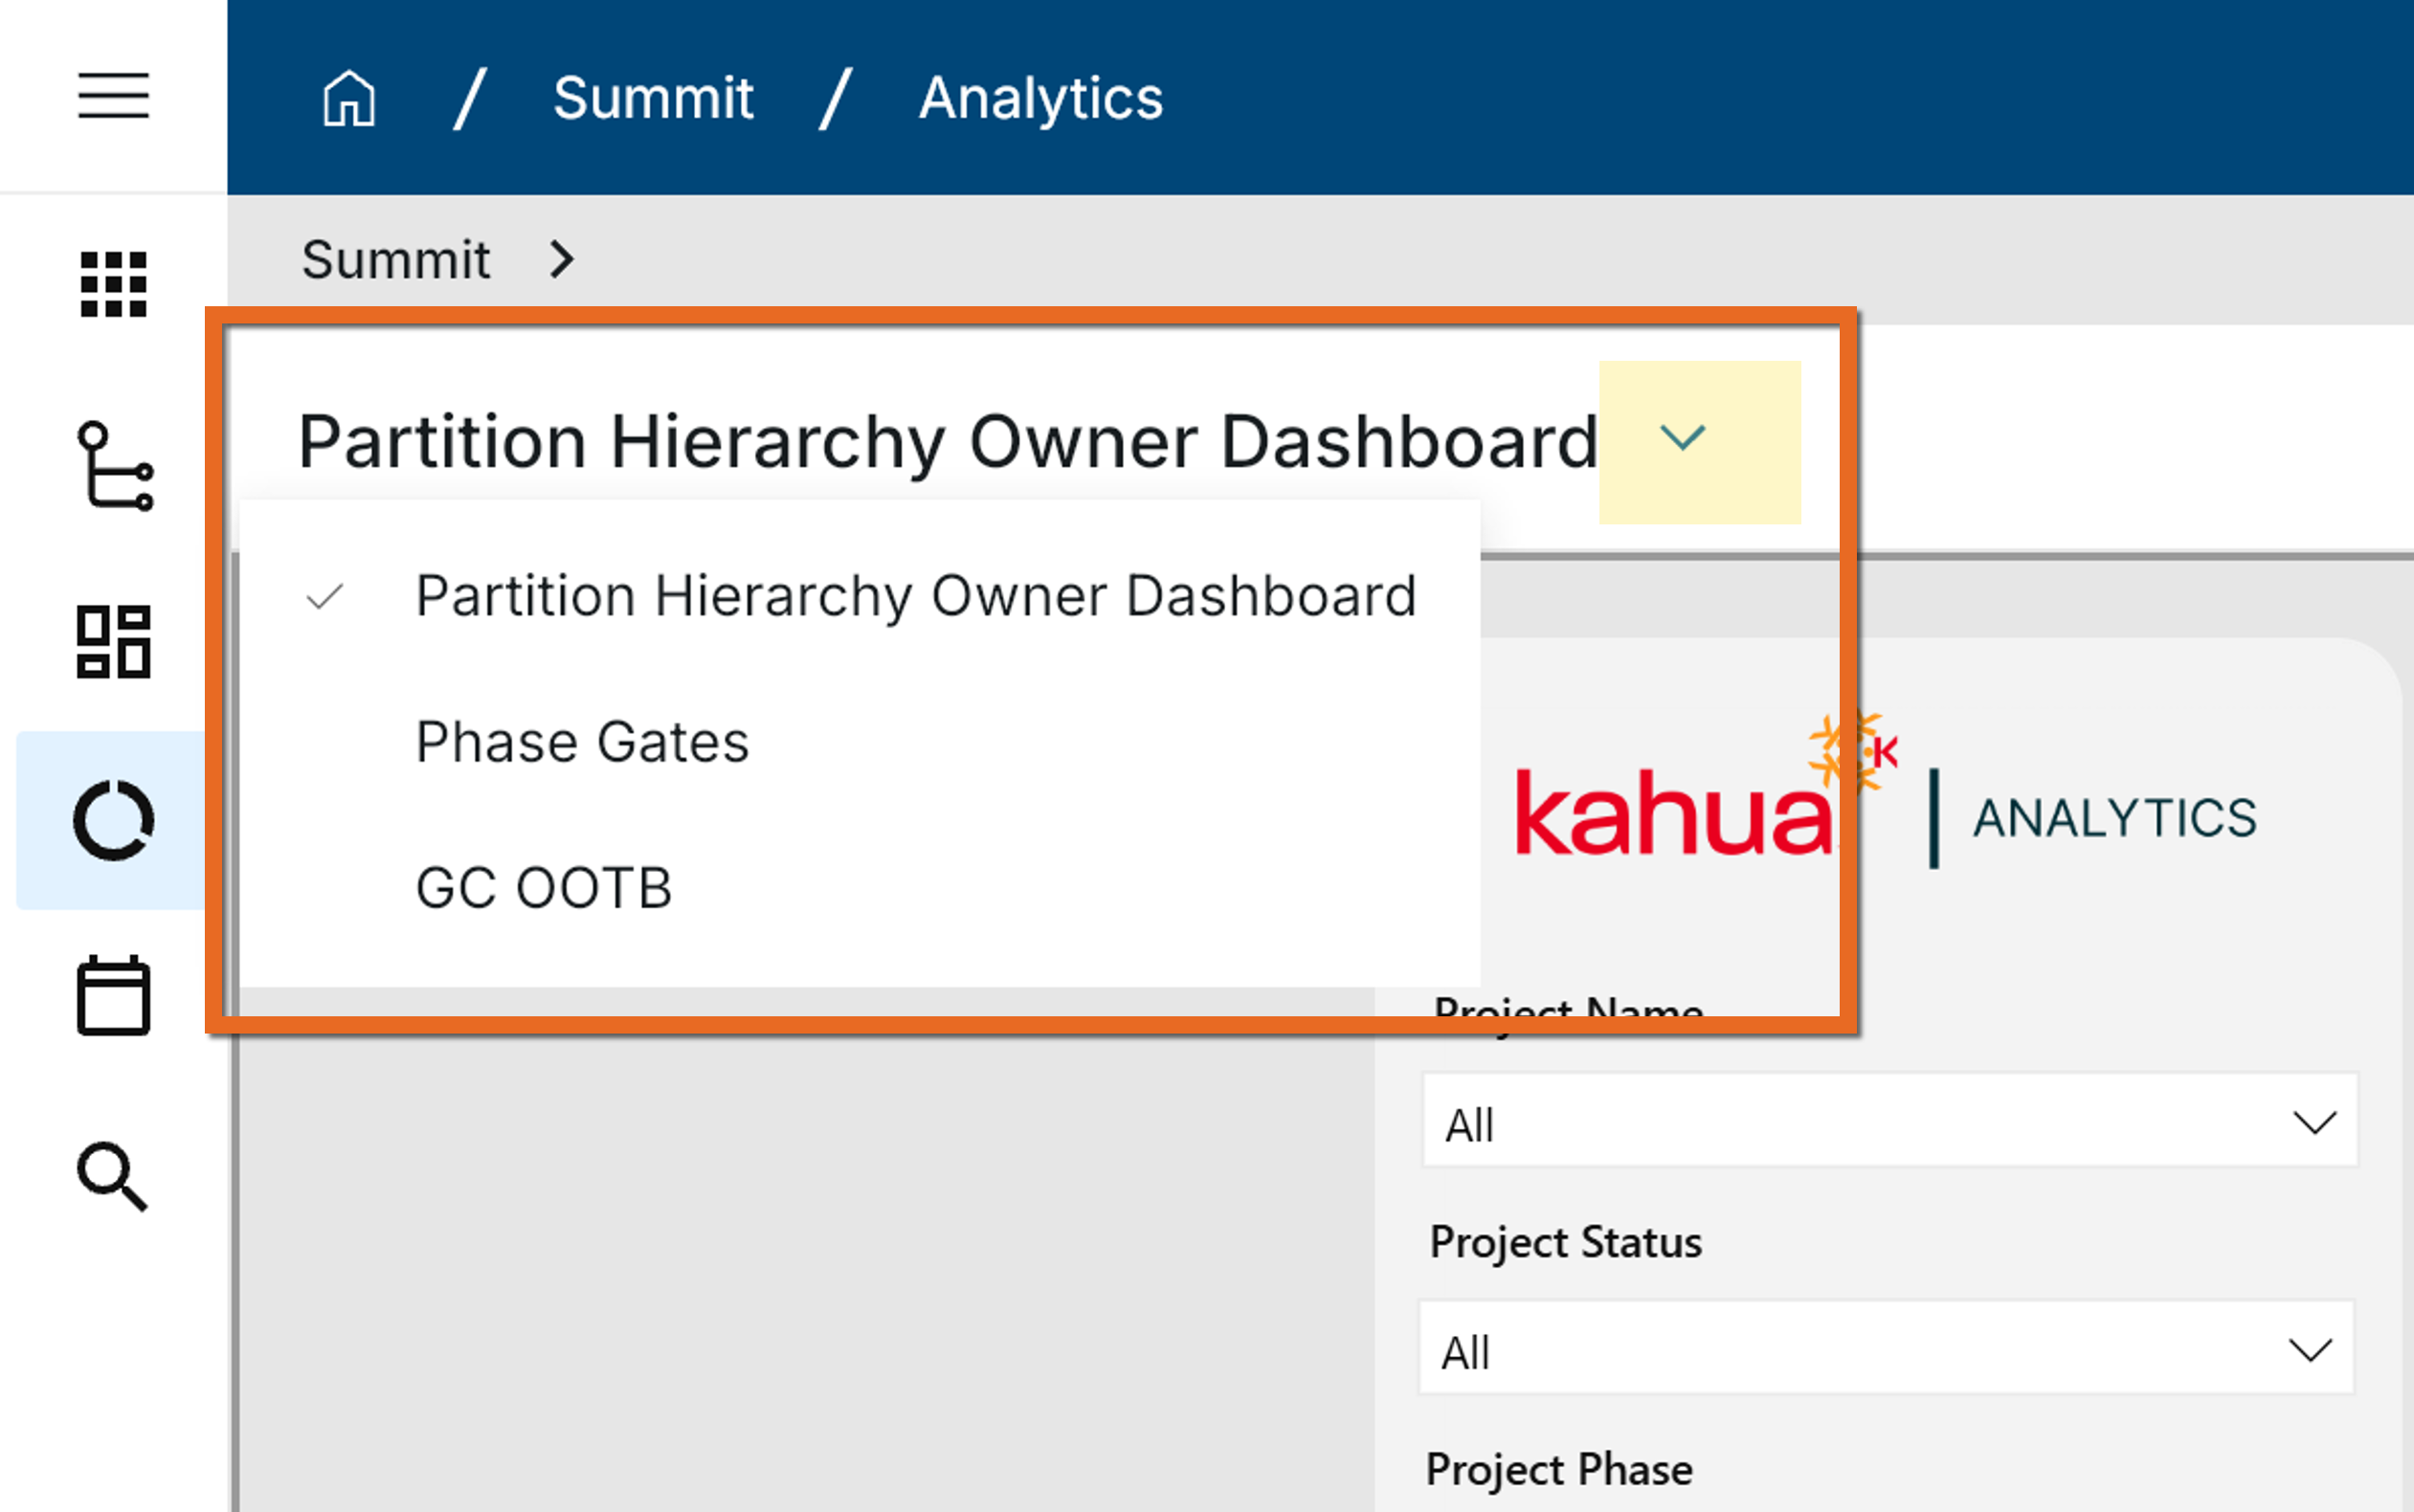
If multiple reports are available in your domain, you can switch between them from within the Analytics application by clicking on the dropdown menu next to the current report name and selecting the desired report.
Refresh and reload report data
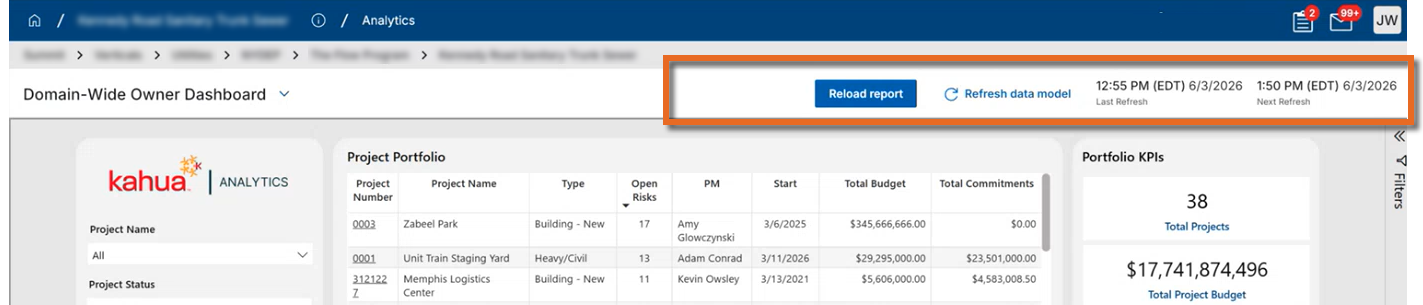
By default, the data underlying a report is automatically refreshed on a schedule configured for that report. The time of the last and next refresh appears on the report header.
-
Last Refresh - The time the latest refresh was completed.
-
Next Refresh - The time the next refresh is scheduled to begin.
When available, you can select Refresh data model to manually refresh the data.
Note At this time, the Refresh data model option is not available for all reports.
The updated data will not be applied to the report until you select Reload Report, or close the report and re-open it.
The following actions occur when you select Reload Report:
-
The report is released with the most recently refreshed data.
-
Any manually applied filters are cleared.
-
The first dashboard in the report appears.
If new data becomes available while you are viewing a report, a notification may appear prompting you to reload the report. You can reload immediately or continue working and reload later.
Work with dashboard visuals
Depending on the type of visual on a dashboard, you may be able to apply one or more of the following actions:

| Action | Description |
|---|---|
Drill up / Drill down  |
Select these options to drill up or down a level. |
Next level  |
Select this option to go to the next level. |
Expand down a level  |
Select this to expand aggregated data down a level. For example, budget data across multiple projects may initially appear grouped by the highest level of a cost code. You can select this option to have the data for each highest level appear broken out by the next level of a cost code. |
Focus mode  |
Select this option to open the visual in its own larger window for more detailed viewing. To return to the dashboard view, select Back to Report.
|
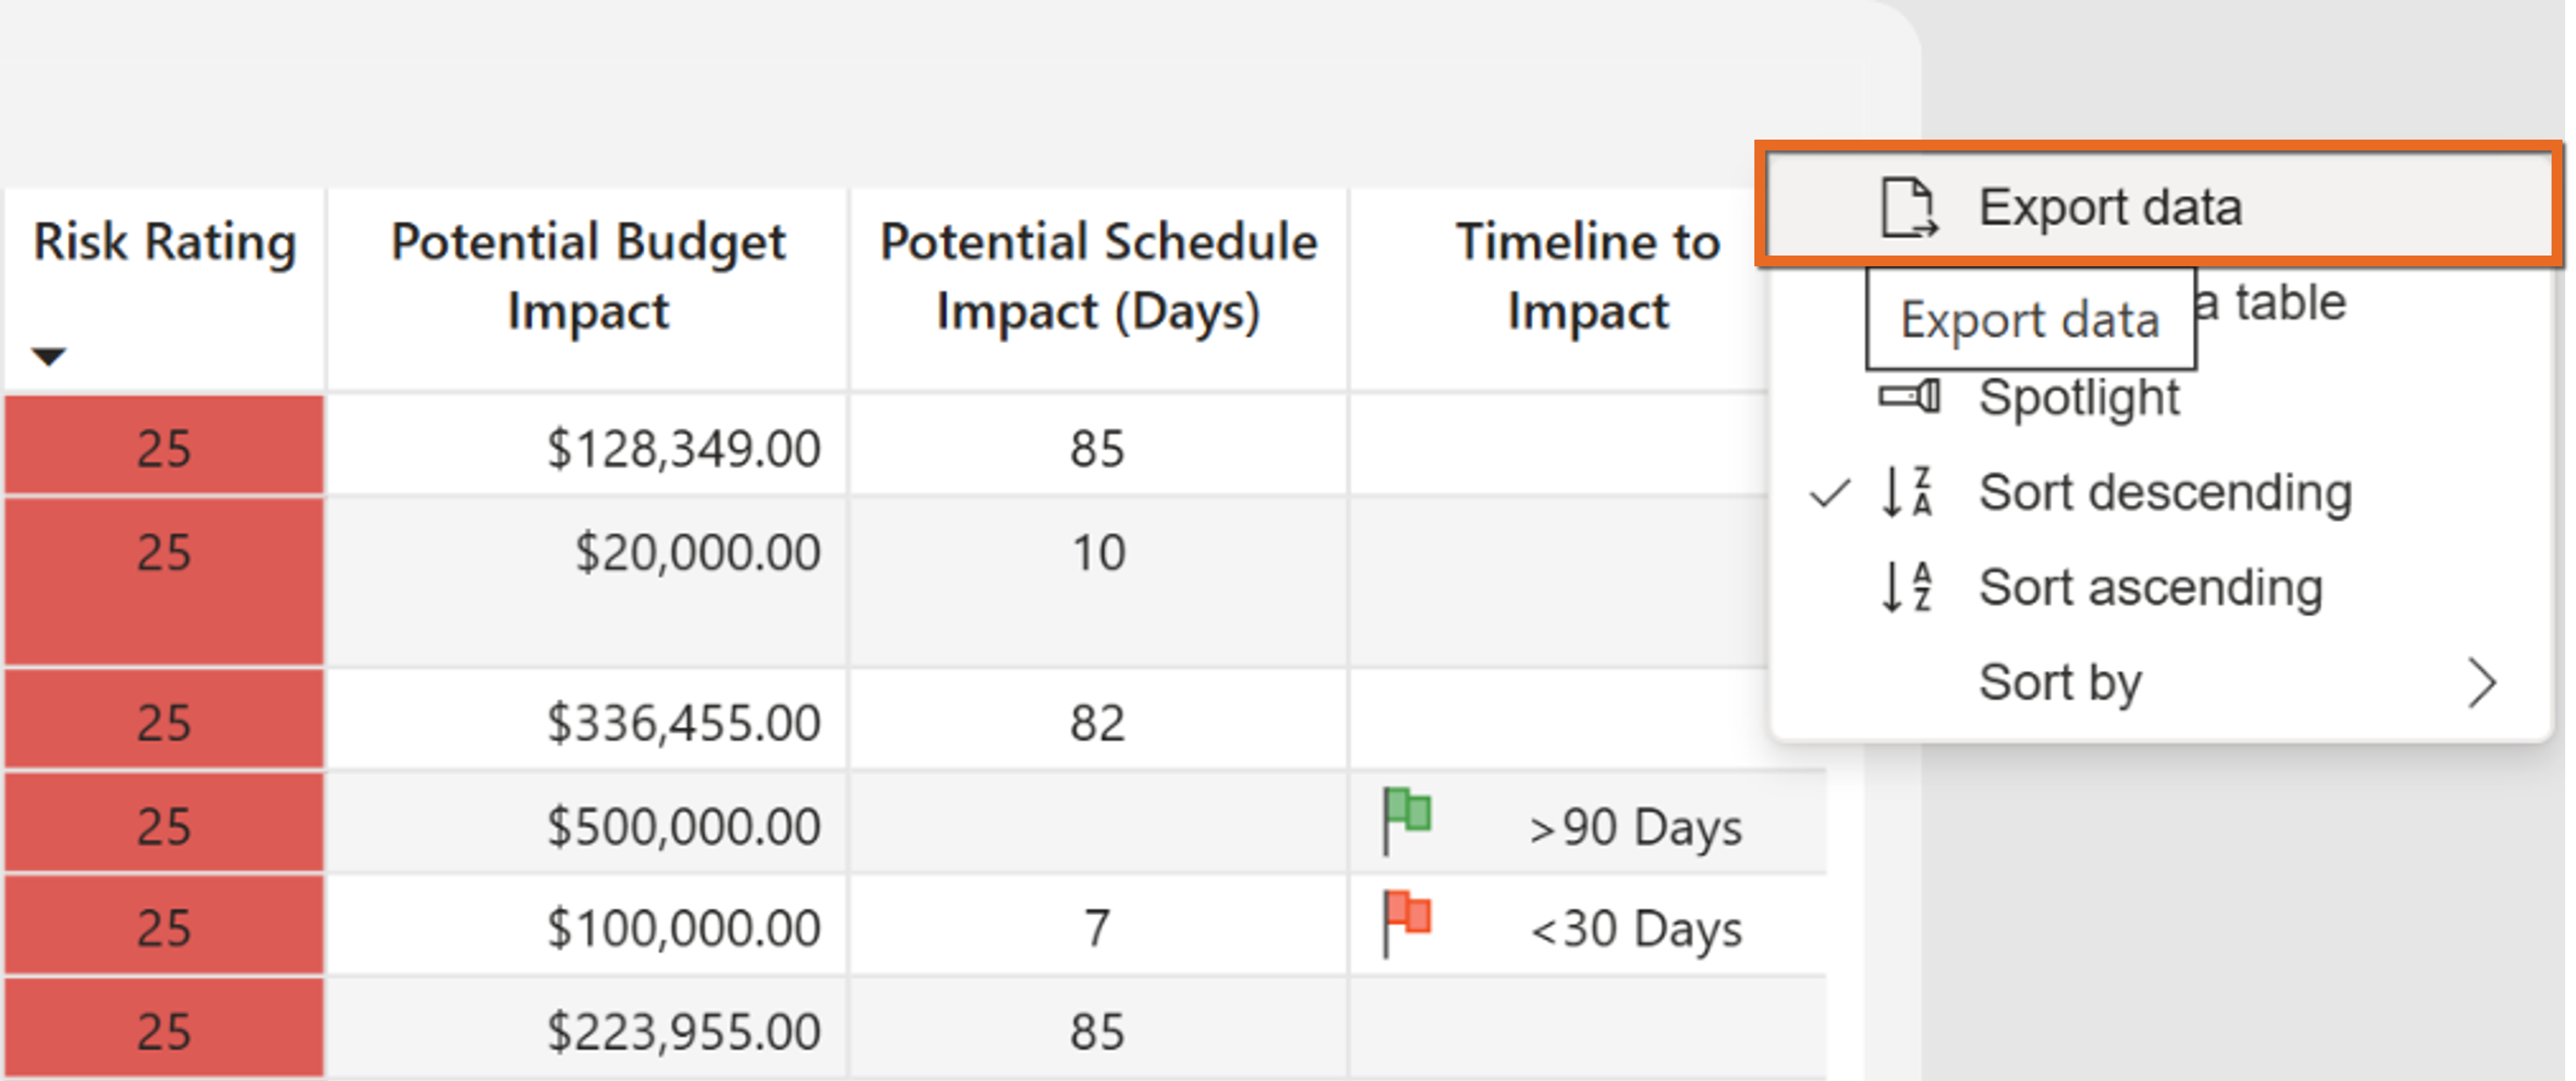
| Export data |
From the More icon
|
|
Open linked record |
Record links can appear as either a link icon or underlined text. Select the link to open a new window containing the associated record in Kahua. |
| Drill Through |
Drill Through allows you to move from one level of data to a more detailed view of a specific record or value. For example, you may be able to move from document-level data to item-level data. Right-click the appropriate cell or data point and select Drill Through. Select the available drill-through destination. Note Drill Through is configured upon request and may not be available in every report. |
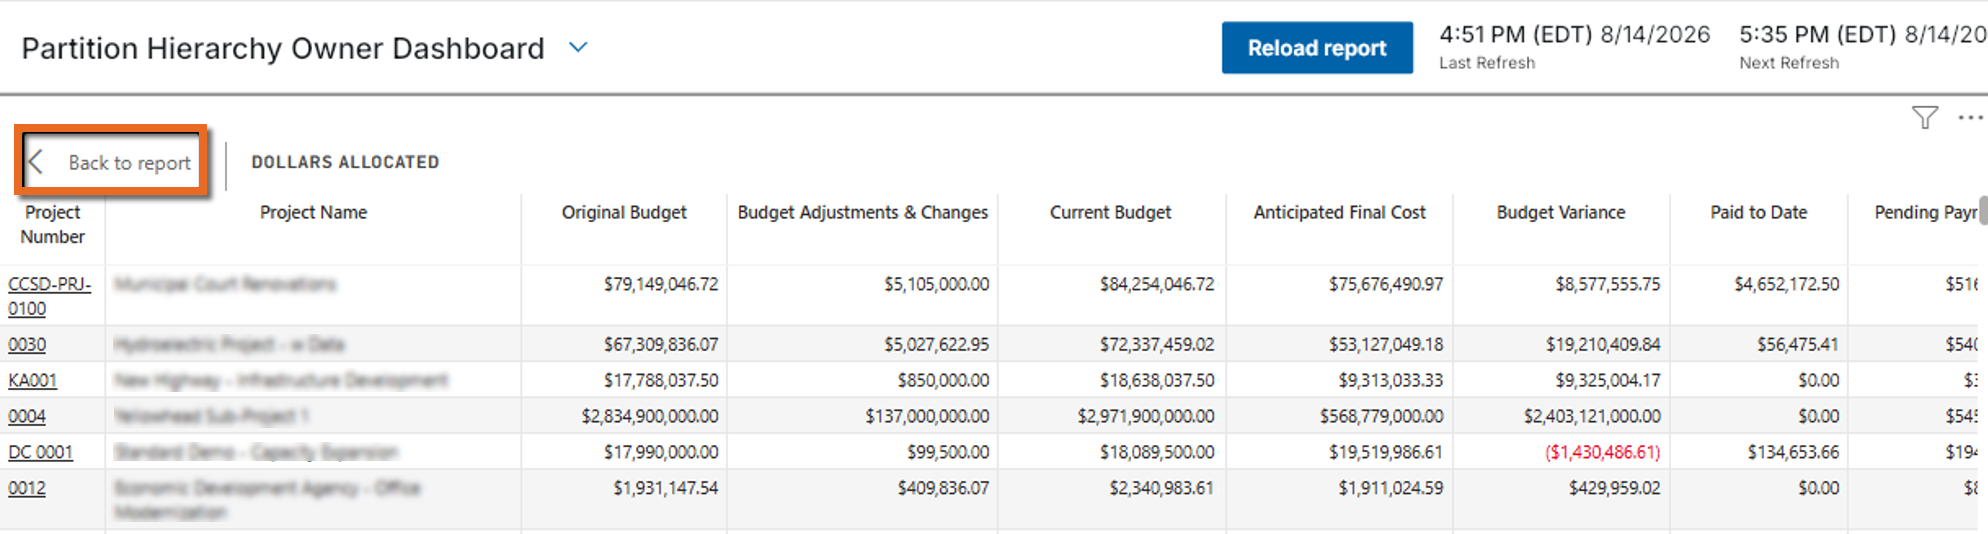
 , select Export data to export the data from the visual to an Excel or CSV file.
 Apply filters to a report
There can be several ways to filter a report. A report can have pre-configured filters available on a dashboard. Additionally, some reports have a filter tab available to the right of the dashboard. If present, click on the filter tab to view filter options.
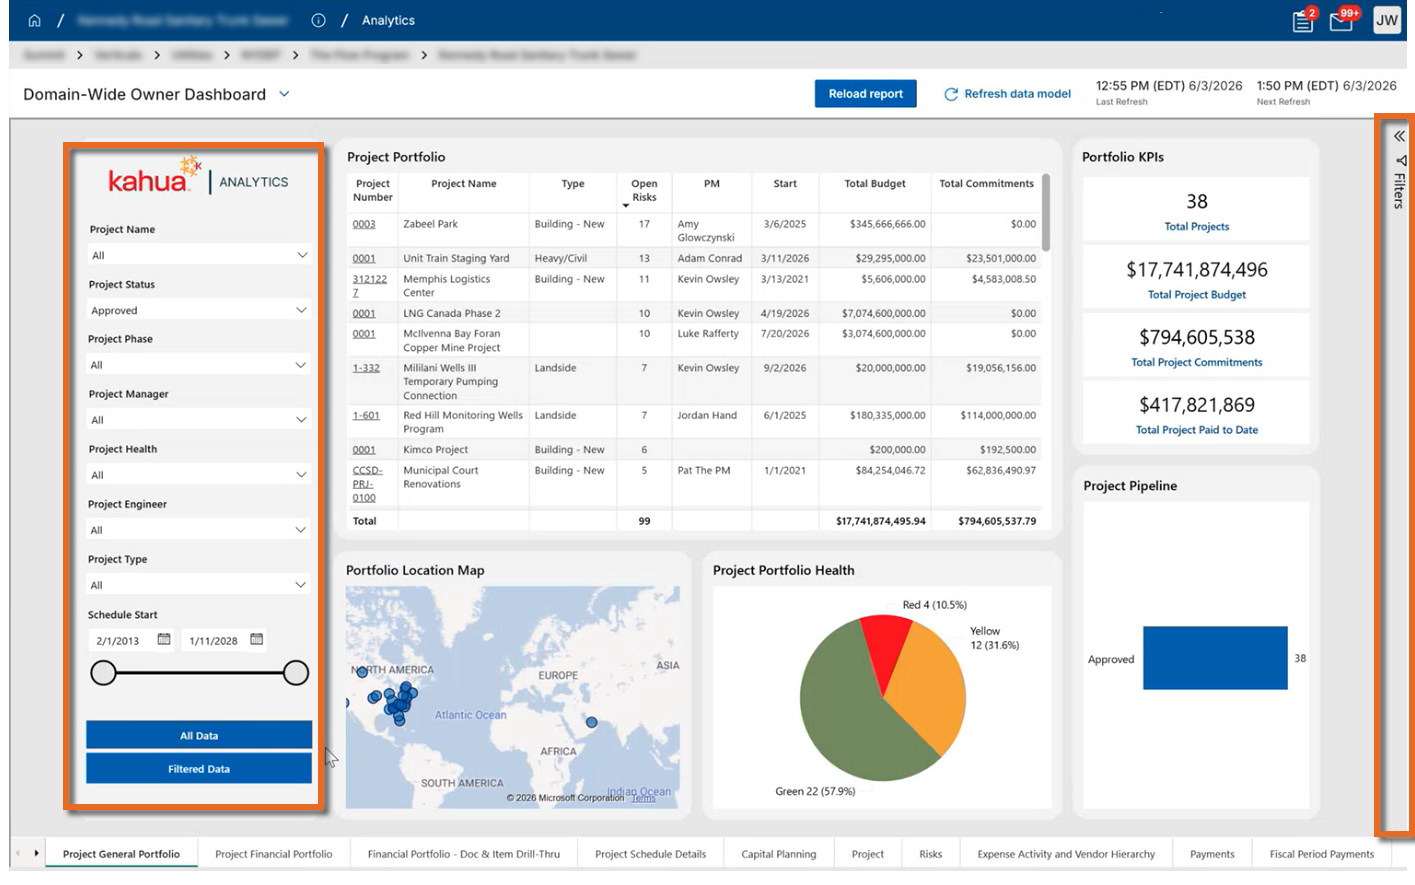
Note To remove any applied filters, select Reload Report.
You can filter dashboard visuals by multiple values, such as multiple projects or statuses by pressing Ctrl while selecting the appropriate filter options.
Understand report scope
The scope of a report determines how it responds when you change partitions or projects.
-
Domain Scope ensures that an Analytics report does not reload during an active Kahua session. It will remain open and display the same data during a single session, irrespective of what partition the user is consuming from. Partition Hierarchy Filtering must be enabled to guard against unwanted data visibility. To reload a domain scoped report users must click the Reload Report button or close the Analytics app.
-
Project Scope reloads the report when the selected partition changes. This is commonly used with Partition Hierarchy Filtering so that the report displays data from the selected partition and the projects below it.
For more information on Kahua's hierarchical structure, refer to Understanding the hierarchical structure of Kahua.
Understand Partition Hierarchy Filtering
Partition Hierarchy Filtering can be enabled during implementation to align the data shown in Analytics with Kahua's hierarchical permissions.
When enabled, users see data from the currently selected project or partition and projects downstream from that point in the hierarchy. Because Kahua permissions can vary throughout the hierarchy, different users may not see the same data in Analytics.
Manage Analytics permissions
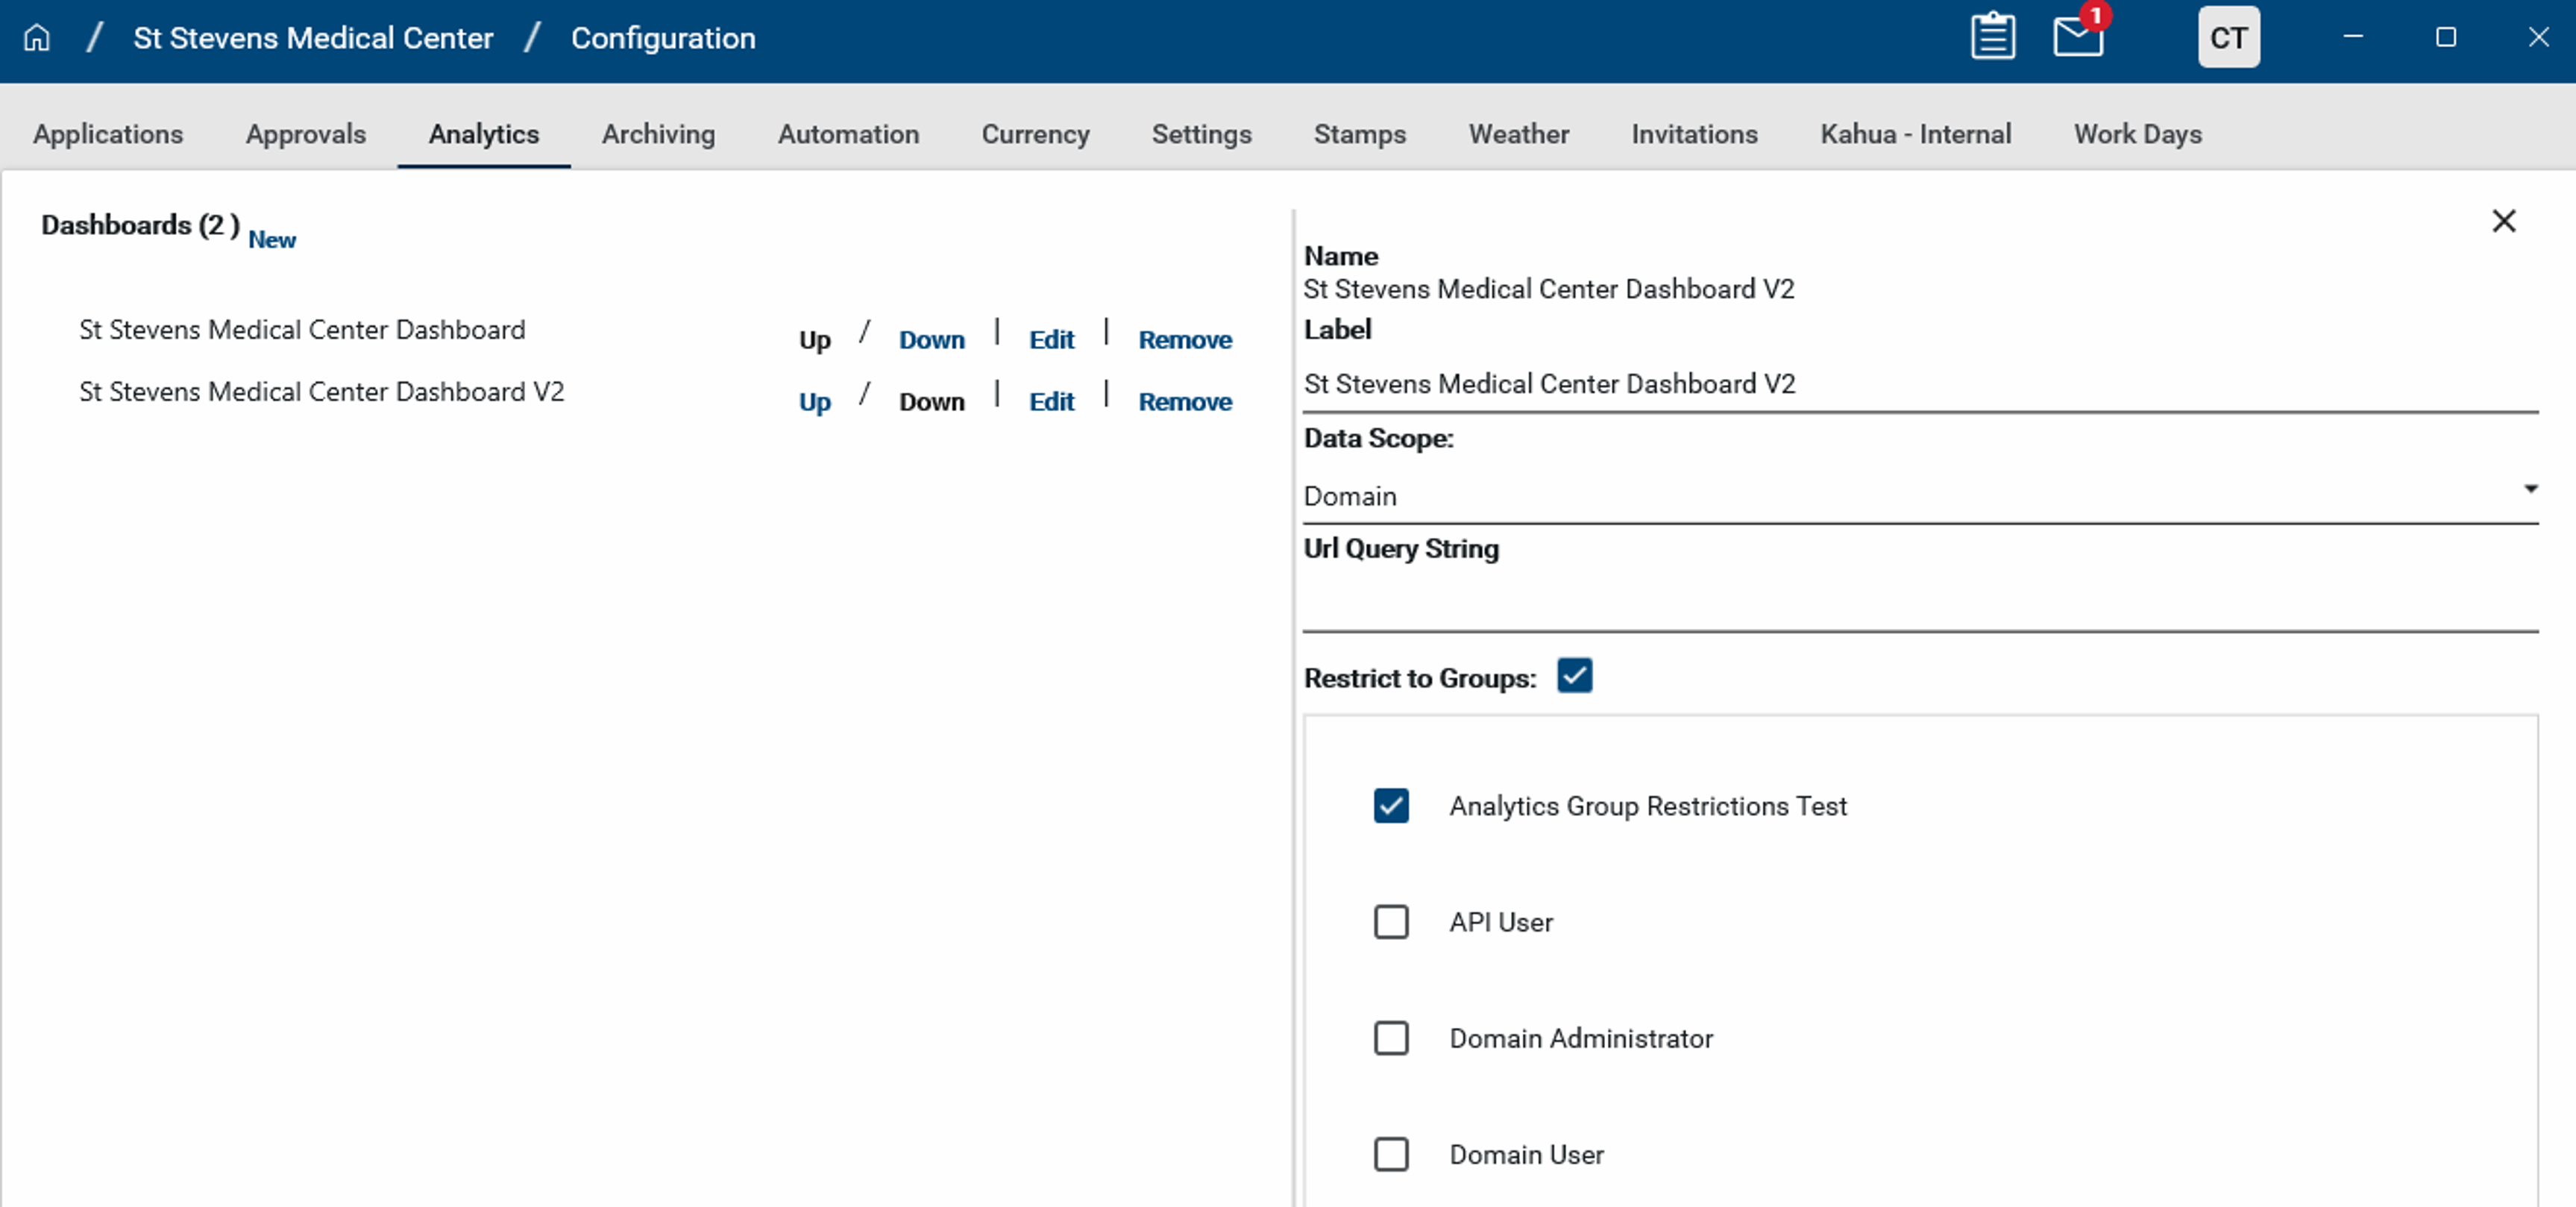
Permissions for Kahua Analytics are managed through the Groups and Configuration applications in Kahua.
The Analytics application must first be enabled for the domain. Access can then be granted through groups. Alternatively, access can be restricted to selected groups through the Analytics tab in the Configuration application.
Troubleshoot common Analytics questions
| Question | Answer |
|---|---|
| How do I submit an Analytics request? |
Contact Kahua's Data Science team at AnalyticsRequests@kahua.com. Format the email subject as follows: [Company Name] – [Affiliation] – [Request Type]
|
| Do I need a Power BI license to use Kahua Analytics? | No. A separate Power BI license is not required to use Kahua Analytics. Analytics is hosted within the Kahua platform. |
| Can I view data from external sources? | Kahua Analytics can only display data entered in Kahua. |
| I entered data in Kahua but do not see it in Analytics. |
Review the Last Refresh and Next Refresh values. Newly entered data may not appear until the next scheduled refresh. Also review the filters in the report. Active filters can exclude data. If the expected data still does not appear, contact your domain administrator because report-wide filters may also be applied. |
| I applied filters and want to return to the default view. | Select Reload Report, or close and reopen the Analytics application. This clears session filters and returns you to the report's default starting dashboard. If available for the filter, you can also select Select all. |
| Why did the report change when I selected a different partition or project? | The report may be configured for Partition Hierarchy Filtering and project scope. In that configuration, the report reloads to show data from the selected location in the hierarchy and downstream projects. |
| Why do I not see the same reports or dashboards as another user? | Report visibility can depend on permissions and configuration. Contact your domain administrator for more information. |
| Can I deploy my own dashboard to Kahua Analytics? |
Customers cannot independently deploy dashboards into Kahua Analytics. A supported path is available through Kahua Analytics Self-Servicing:
|